Leveraged ETFs in the U.S. Market — April 2026 Analysis
What leveraged ETFs actually do, when they work, and why long-term holding can go very right or very wrong. Daily-reset mechanics, volatility drag, and ETF-by-ETF analysis.
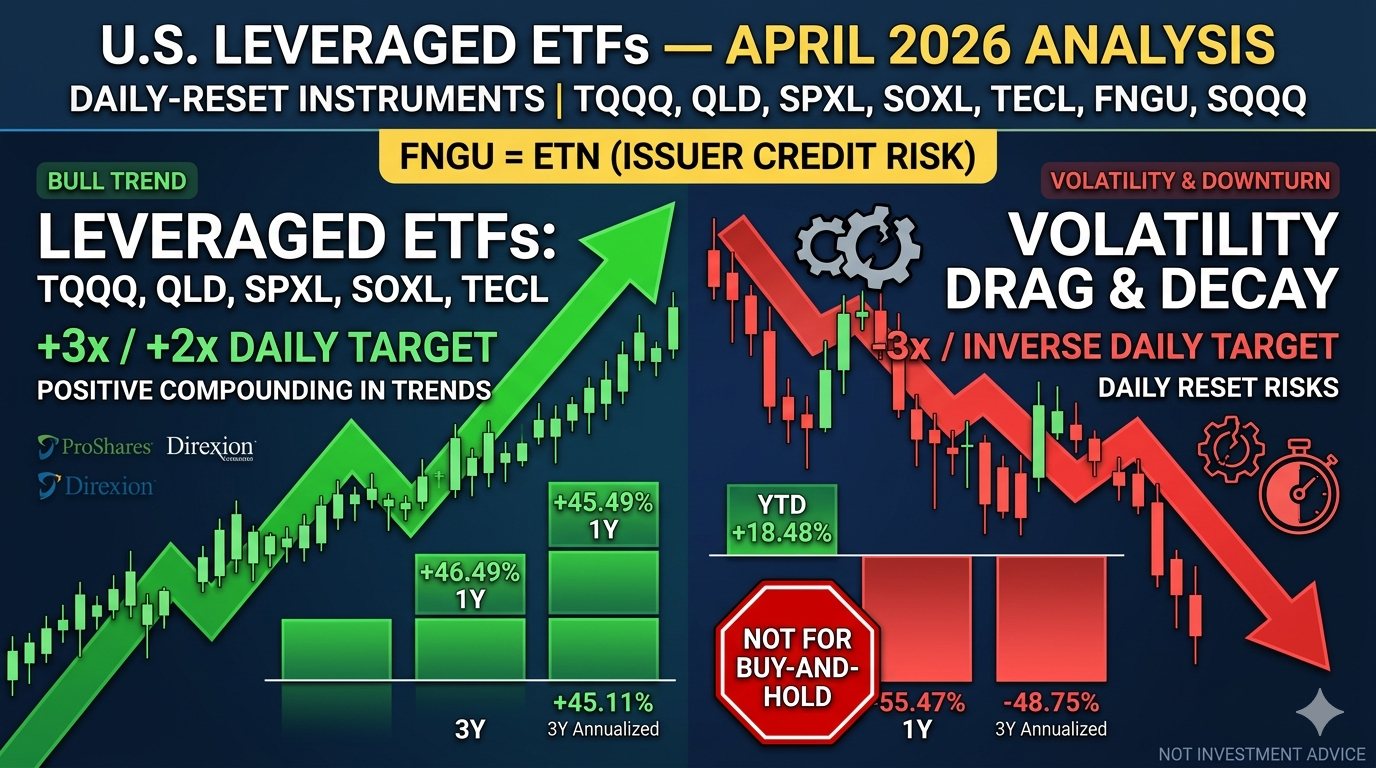
The first thing to understand is simple: the products in this report are not just "faster versions" of normal index ETFs. They are daily-reset instruments designed to deliver a multiple of one day's return, not a long-term multiple of an index's cumulative return. That applies to TQQQ, QLD, SPXL, SOXL, TECL, and SQQQ. FNGU is even more specialized because it is an ETN, not an ETF, which adds issuer credit risk on top of leverage. The SEC and FINRA have both warned that leveraged and inverse products can perform very differently from what investors expect if they are held longer than a day, especially in volatile markets.
In other words, these are not inherently "good" or "bad" products. They are tools. Used with a short time horizon, a clear thesis, and tight risk management, they can be effective. Used as casual buy-and-hold vehicles, they can become expensive lessons in compounding, volatility drag, and path dependence.
The Main Products Investors Actually Use
The group covered here spans most of the U.S. retail leveraged universe that matters in practice: leveraged Nasdaq, leveraged S&P 500, leveraged tech and semiconductors, concentrated mega-cap tech, and inverse Nasdaq.
TQQQ — ProShares UltraPro QQQ — ETF — +3x daily — Nasdaq-100 — $49.17 — 0.82% net expense ratio
QLD — ProShares Ultra QQQ — ETF — +2x daily — Nasdaq-100 — $68.19 — 0.95% net expense ratio
SPXL — Direxion Daily S&P 500 Bull 3X — ETF — +3x daily — S&P 500 — $209.76 — 0.84% net expense ratio
SOXL — Direxion Daily Semiconductor Bull 3X — ETF — +3x daily — NYSE Semiconductor Index — $76.39 — 0.75% net expense ratio
TECL — Direxion Daily Technology Bull 3X — ETF — +3x daily — Technology Select Sector Index — $105.95 — 0.87% net expense ratio
FNGU — MicroSectors FANG+ 3X Leveraged — ETN — +3x daily — NYSE FANG+ — $19.60 — 0.95% investor fee plus daily financing charge; issuer credit risk
SQQQ — ProShares UltraPro Short QQQ — ETF — -3x daily — Nasdaq-100 — $67.62 — 0.95% net expense ratio
One important note: SOXL currently seeks 300% of the NYSE Semiconductor Index, not the Philadelphia Semiconductor Index. And FNGU is an ETN, not an ETF. Issuer page snapshots as of approximately April 10, 2026. Source: issuer pages and fund snapshots.
What Leveraged ETFs Actually Do
Each of these products targets a multiple of the daily move in its benchmark. TQQQ targets 3x the Nasdaq-100's daily move; QLD targets 2x; SPXL targets 3x the S&P 500; SOXL and TECL target 3x sector exposure; SQQQ targets -3x the Nasdaq-100. Sponsors are explicit that investors should not expect the funds to deliver those same multiples over periods longer than one day. ProShares says returns over longer holding periods may be higher or lower than the daily target, and those differences can be significant; Direxion says its funds should not be expected to provide 3x or -3x of cumulative returns over periods greater than one day.
Mechanically, this happens because leveraged and inverse products use derivatives and daily rebalancing. FINRA notes that these funds commonly use swaps, futures, and other derivatives to achieve their objectives, and that compounding can make long-period performance diverge sharply from the benchmark multiple investors think they are buying. The SEC makes the same point even more bluntly: performance over periods longer than one day can differ significantly from the stated daily objective and can expose investors to significant and sudden losses.
There is also an important structural distinction inside this group. FNGU is not a fund that holds assets in the same way an ETF does. It is a senior unsecured debt obligation of Bank of Montreal. That means investors are taking not only leverage and daily-reset risk, but also issuer credit risk, financing-charge drag, and call/redemption risk. That is a meaningful difference, and it makes FNGU the most structurally aggressive vehicle in the group.
What the Recent Numbers Are Actually Telling Investors
The official month-end performance data tells a clear story. Broad leveraged bull funds have been painful in early 2026, but still strong on a trailing one-year and three-year basis. Sector funds have been even more extreme. Inverse Nasdaq exposure has done what it is supposed to do in the short run during weakness, but its multi-year record remains brutal. All figures are most recent issuer-published market-price total return snapshots as of March 31, 2026.
TQQQ: YTD -20.81%, 1Y +46.49%, 3Y +45.11% annualized, 5Y +13.87% annualized, 10Y +35.27% annualized. A strong long-run bull-market winner, but extremely vulnerable to sharp drawdowns.
QLD: YTD -13.35%, 1Y +37.53%, 3Y +35.28% annualized, 5Y +16.01% annualized, 10Y +29.63% annualized. Less explosive than TQQQ, but meaningfully more forgiving.
SPXL: YTD -15.99%, 1Y +32.73%, 3Y +37.48% annualized, 5Y +17.69% annualized, 10Y +25.55% annualized. Broad-market 3x exposure behaves better than narrow sector 3x exposure.
SOXL: YTD +13.99%, 1Y +201.29%, 3Y +38.77% annualized, 5Y +5.29% annualized, 10Y +40.15% annualized. Massive upside in the right cycle, but highly unstable over medium-term holding periods.
TECL: YTD -26.25%, 1Y +59.43%, 3Y +36.30% annualized, 5Y +18.09% annualized, 10Y +37.65% annualized. Cleaner than semis, but still a very high-beta growth instrument.
SQQQ: YTD +18.48%, 1Y -55.47%, 3Y -48.75% annualized, 5Y -42.89% annualized, 10Y -52.69% annualized. Useful as a hedge; destructive as a long-term bearish holding.
That table contains the main investing lesson. Trend matters more than the label. In a powerful bull market, leveraged long funds can deliver extraordinary multi-year results. But concentration matters just as much. SOXL's official data is the cleanest example in the set: it posted roughly +201% over one year, yet only about +5.3% annualized over five years. That is not a contradiction. It is what happens when huge upside bursts are interrupted by equally huge drawdowns.
SQQQ teaches the opposite lesson. It can rally fast when Nasdaq falls, and it is doing that on a year-to-date basis in 2026. But the same official page shows deeply negative 1-year, 3-year, 5-year, 10-year, and since-inception returns. That is why inverse daily products work far better as hedges or trades than as permanent portfolio views.
The Real Advantages of Leveraged ETFs
The best argument for leveraged ETFs is not "higher returns." It is capital efficiency. They allow an investor to express a strong short-term view without using a margin account directly. TQQQ, QLD, and SQQQ also trade with meaningful liquidity and tight spreads; ProShares' own pages show 30-day median bid-ask spreads of around 0.02% for TQQQ and QLD and 0.01% for SQQQ, alongside heavy trading volume. Direxion's large funds are also very liquid, especially SOXL.
There is also a legitimate use case for hedging. ProShares explicitly markets SQQQ as both a downturn tool and a portfolio hedging tool. For investors facing a short catalyst window — CPI, a Fed meeting, an earnings week, or a known event risk — an inverse vehicle can be simpler than shorting, and operationally easier than options for some accounts.
Finally, leveraged products can work very well in clean, persistent trends. The official sponsor language even acknowledges this indirectly: when index moves are large and volatility is relatively low, returns can be better than the headline daily multiple over longer periods because of positive compounding. That is one reason why funds like TQQQ and SPXL can look spectacular over strong multi-year bull runs.
The Disadvantages Investors Underestimate
The biggest risk is not the expense ratio. It is path dependence. Two portfolios can start and end at the same index level, yet a leveraged ETF holder can still lose money because the sequence of daily moves matters. FINRA's guidance says the compounding effect can be severe enough that a leveraged ETF may lose money even when the underlying index rises over the same period. The SEC makes the same point for buy-and-hold investors.
The second major risk is volatility drag. The more volatile the path, the more frequently the fund is forced to rebalance after large up and down moves. That means investors can "buy high and sell low" mechanically inside the product itself, even if they never trade. Sponsors say the same thing in gentler language: smaller index gains or losses and higher volatility contribute to returns worse than the stated daily target.
The third risk is concentration risk. SPXL is a broad 3x U.S. equity tool. SOXL is a leveraged bet on semiconductors. TECL is a leveraged bet on the tech sector. FNGU is a 3x daily note tied to an equal-weighted 10-stock basket of high-growth names. The more concentrated the benchmark, the less forgiving the holding period tends to be.
And in FNGU's case, investors are taking a risk many retail buyers barely notice: issuer credit risk. BMO's own ETN documents say the note is a senior unsecured debt obligation of Bank of Montreal, is not intended as a buy-and-hold investment, and can suffer significant losses even if the long-term performance of the underlying index is positive. That is a very different risk stack from holding a plain equity ETF.
What Happens If You Hold Them Longer Than Intended
The easiest way to understand leveraged products is with simple arithmetic. These are illustrations, before fees, spreads, and taxes.
Smooth uptrend: +1% every day for 20 trading days — Index: +22.0%, 2x fund: +48.6%, 3x fund: +80.6%, -3x fund: -45.6%
Round trip: +10% day one, -9.09% day two — Index: ~0.0%, 2x fund: -1.8%, 3x fund: -5.5%, -3x fund: -10.9%
Choppy tape: +2%, -2%, repeated for 20 sessions — Index: -0.4%, 2x fund: -1.6%, 3x fund: -3.5%, -3x fund: -3.5%
Clean downtrend: -1% every day for 20 trading days — Index: -18.2%, 2x fund: -33.2%, 3x fund: -45.6%, -3x fund: +80.6%
These examples are why daily-reset leverage is so misunderstood. In a clean trend, compounding can help. In a flat but volatile market, it hurts. In a downtrend, inverse funds can do exactly what holders want — but only if the move is fast, directional, and the investor's timing is right.
That is also why leveraged products feel so different from normal ETFs. With SPY or QQQ, the key question is direction. With TQQQ, SOXL, or SQQQ, the key questions are direction, volatility, and time horizon. Get all three right and the product works beautifully. Miss one and the outcome can disappoint even if your market view was broadly correct.
ETF-by-ETF Investor Takeaways
TQQQ is the flagship aggressive bull vehicle. It is the best-known retail expression of a high-conviction Nasdaq bull view. The official page shows it was down 20.81% YTD as of March 31, 2026, yet still up 46.49% over one year and 45.11% annualized over three years. That tells you exactly what TQQQ is: outstanding in persistent bull phases, brutal in sharp corrections.
QLD is the more usable version of the same idea. It still carries real path-dependence risk, but 2x daily leverage is materially more forgiving than 3x. On the official page, QLD was down 13.35% YTD but up 37.53% over one year and 35.28% annualized over three years. For investors who insist on holding leveraged Nasdaq exposure beyond a brief tactical window, QLD is the least structurally aggressive way to do it in this group.
SPXL is the broadest risk-on instrument in the set. If the goal is to express a bullish macro view on U.S. equities rather than a narrow view on tech leadership, SPXL is cleaner than TQQQ, TECL, or SOXL. Its official market-price performance as of March 31 showed +32.73% over one year and +17.69% annualized over five years, which is strong, but not nearly as violent as the sector funds.
SOXL is the purest example of why leverage and concentration are a dangerous combination. It is tied to the NYSE Semiconductor Index, not a broad tech basket. The official numbers are extraordinary and cautionary at the same time: +201.29% over one year, but only +5.29% annualized over five years on a market-price basis. SOXL is a very powerful trading product. It is a much less dependable investment product.
TECL sits between broad tech and semiconductor mania. It tracks the Technology Select Sector Index, so it is still concentrated, but less cyclical than semiconductors alone. Officially it was down 26.25% YTD and up 59.43% over one year, with 18.09% annualized over five years. In practice, TECL works best when mega-cap tech leadership is broad and stable.
FNGU is the most aggressive expression of concentrated big-tech momentum in this group. It is linked to the equal-weighted NYSE FANG+ Index, which currently consists of just 10 stocks, and the issuer explicitly says it is not intended to be a buy-and-hold investment. Because it is an ETN, holders also bear Bank of Montreal credit risk and financing-charge drag. Treat FNGU as a tactical note, not as a core allocation tool.
SQQQ is a hedge, not a home. ProShares markets it as a downturn and hedging product, which is fair. But its official return history makes the long-term case against buy-and-hold inverse exposure all by itself: deeply negative one-year, three-year, five-year, ten-year, and since-inception returns despite periodic market selloffs. If you are bearish for a week, SQQQ can make sense. If you are bearish "for the next few years," reducing equity exposure is usually a cleaner solution.
The Practical Investor Framework
For most investors, the best way to think about these products is not "Which one will make me the most money?" but "Which one fits the time horizon of my view?" If your view lasts days, leveraged ETFs can be useful. If your view lasts quarters or years, the instruments become much less reliable because daily reset mechanics take over. That is exactly why SEC and FINRA both frame them as specialized products with extra risks for buy-and-hold investors.
The practical framework: QLD and SPXL are the most usable broad tactical long products. TQQQ is for investors who want maximum Nasdaq beta and fully accept higher drawdown risk. TECL is a growth-cycle trade. SOXL and FNGU are momentum instruments and should be treated with the shortest leash. SQQQ is best reserved for hedging or short tactical bearish windows, not for strategic portfolio construction.
The most important rule: do not use a 3x product to solve a problem that position sizing can solve more cleanly in an unlevered ETF. If a normal allocation to QQQ, SPY, XLK, or SMH already captures your thesis, that is usually the more durable long-horizon approach. Leveraged products make the most sense when the thesis is strong, the horizon is short, and the exit plan is already defined.
Bottom Line
Leveraged ETFs are excellent tactical tools and poor substitutes for long-term discipline.
Best broad-market tactical tools: QLD, SPXL
Best aggressive bull expressions: TQQQ, TECL
Highest-risk momentum trades: SOXL, FNGU
Best used as a hedge, not a holding: SQQQ
The historical record says the same thing. In powerful trends, leveraged bull funds can compound far better than many investors expect. In sideways or highly volatile markets, the same structure becomes a tax on patience. And in inverse products, time is usually the enemy unless the decline is sharp and immediate.
For an investor reading this report for practical use, the cleanest conclusion is not "never touch leveraged ETFs." It is: use them only when your market view is strong enough to justify leverage, short enough to survive daily reset effects, and disciplined enough to tolerate being wrong quickly.
Share your analysis
Keep it data-driven. No investment advice.
- Keep it data-driven and respectful
- No investment advice (buy / sell / hold)
- No spam, promotion, or solicitation
- No profanity or offensive content
- Violations are automatically removed
Data: Financial Modeling Prep, Alpha Vantage, CoinGecko
NOT investment advice. Always do your own research.