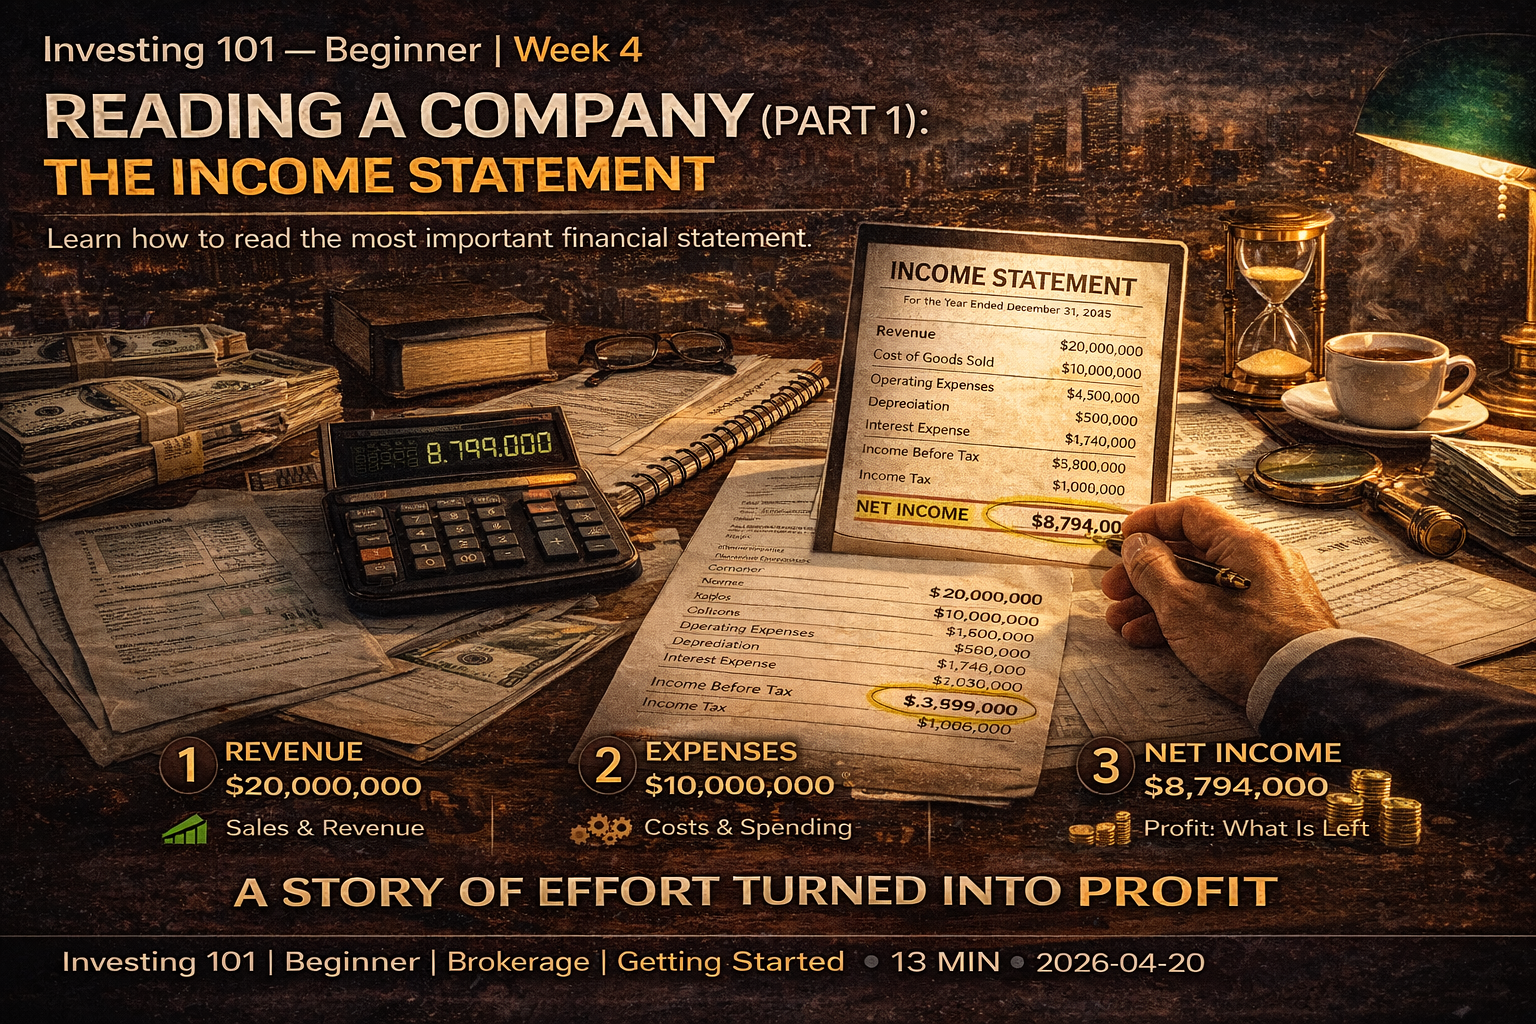
Reading a Company (Part 1): The Income Statement
The income statement is a story about how a business turned effort into money over a specific period. Learn to read it, and you can read most of what matters about a company.
Reading a Company (Part 1): The Income Statement
The first three weeks were about orientation. What stocks are. How markets work. How to connect to them. You now have, or are about to have, an account that can buy shares of any publicly traded company on the planet.
The question is: which ones?
And to answer that, you need to learn to read a business. Not its stock chart — anyone can look at a chart. You need to be able to open up the actual financial statements of a company and understand what the business is doing, how well it is doing it, and whether that trajectory is getting better or worse.
Financial statements come in three main forms: the income statement, the balance sheet, and the cash flow statement. Each tells a different part of the story. For the next three weeks, we will take them one at a time. Today, we start with the one most beginners encounter first — and the one that is most often misread.
What the Income Statement Is
The income statement — sometimes called the "profit and loss statement" or "P&L" — is a financial report that summarizes how a business performed over a specific period of time. Usually a quarter or a year.
That last phrase matters: over a period of time. The income statement is not a snapshot. It is a summary of activity. It says: "Here is what happened between January 1 and December 31." It tells you how much money came in, how much went out, and what was left over.
Think of it as a story with a beginning, middle, and end. At the top, you see how much the business sold. As you move down, you see all the costs it subtracted to produce those sales. At the bottom, you see what remained as profit. The structure is almost always the same across companies, which means once you learn to read one, you can read them all.
Every publicly traded company is legally required to publish an income statement every quarter, as part of their SEC filings in the US (the 10-Q for quarterly and 10-K for annual reports). These filings are freely available to anyone with an internet connection. You do not need a subscription. You do not need a broker. You can pull up Apple's or Tesla's or Walmart's full income statement in under a minute.
The Shape of an Income Statement
Here is the basic structure, from top to bottom:
Revenue (or Sales, or Net Sales) — The total amount of money the company brought in from its business activities during the period.
Cost of Revenue (or Cost of Goods Sold, COGS) — The direct costs of producing whatever the company sold. For a manufacturer, this is raw materials and factory labor. For a software company, it is hosting costs and customer support. For a retailer, it is the wholesale cost of merchandise.
Gross Profit — Revenue minus Cost of Revenue. What is left after paying to make the product, before any other costs.
Operating Expenses — All the other costs of running the business that are not directly tied to producing the product. This typically includes: research and development (R&D), sales and marketing, and general and administrative expenses (G&A).
Operating Income — Gross Profit minus Operating Expenses. This is the profit the business generates from its core operations, before things like interest payments and taxes. Sometimes called "operating profit" or "EBIT" (earnings before interest and taxes).
Interest Expense and Other Items — Costs and gains that are not part of regular operations. Interest paid on debt. Gains or losses from investments. One-time items.
Pre-Tax Income — Operating Income adjusted for all the non-operating items.
Tax Expense — What the company owes governments on its profits.
Net Income — The final line. Often called "the bottom line" because it literally sits at the bottom. This is what the business earned for its owners after every cost has been subtracted.
That is the full structure. Every income statement you will ever read follows some version of this template. Some companies combine certain lines or break them out into more detail, but the logic is identical.
Revenue: The Top Line
Revenue is the purest measure of commercial activity. It is how much the business sold during the period, before any costs are considered.
When investors say a company "beat revenue expectations" or "missed the top line," this is the number they are referring to. Revenue is so important because it represents the business's ability to find customers and sell them something. You can improve profit margins by cutting costs for a while. You can only grow revenue by genuinely becoming a bigger, more productive business.
A few things matter about how you read revenue.
Growth rate over time. A single revenue number tells you almost nothing. You need to compare it to previous periods. Is this year's revenue higher than last year's? By how much? Is the growth rate accelerating or slowing? A business that grew revenue 20% this year but 40% last year is decelerating — and that change may matter more than the absolute size.
Seasonal patterns. Many businesses have strong seasonality. A retailer sells far more in Q4 than in Q2. A cruise line books heavily in the summer. Comparing a single quarter against the previous quarter can mislead you if you do not account for seasonality. The standard investor move is to compare quarters year-over-year — Q4 this year vs Q4 last year — which controls for seasonality.
Organic vs acquired growth. If a company grows revenue by buying another company, that is not the same as growing revenue by selling more of its own products. The underlying business may not be growing at all — it just acquired a business that was already producing that revenue. Sophisticated investors distinguish between "organic growth" and "inorganic growth" for this reason. You usually have to read the earnings commentary to figure out which is which.
Revenue quality. Not all revenue is equally valuable. A business that sells a one-time widget for $100 booked that $100 in revenue. A software business that signs a customer to a $100/year subscription that will renew for years also books $100 this year — but the underlying business is very different. Recurring revenue, contracted revenue, and high-retention revenue are generally worth more per dollar than one-time transactional revenue. Investors apply different valuations accordingly.
Gross Profit and the Meaning of Margin
After revenue comes the first major cost line: what it costs to actually produce what you sold. Subtract that, and you get gross profit.
More useful than gross profit in dollars is gross margin, which is gross profit expressed as a percentage of revenue.
Gross margin = Gross Profit / Revenue
A software company might have a gross margin of 80%. Every dollar of revenue costs them only 20 cents to produce, and 80 cents is available to cover operating expenses and eventually become profit.
A grocery store might have a gross margin of 25%. Every dollar of revenue costs them 75 cents (mostly the wholesale cost of food), and only 25 cents is available for everything else.
A hedge-funded startup might have a gross margin of -10%, meaning they are selling products for less than they cost to make, subsidizing growth with investor money. Not a sustainable state.
Gross margin tells you something fundamental about the economics of a business. High-margin businesses have more room to invest, more room to absorb shocks, and more room to be profitable at scale. Low-margin businesses have to be operationally excellent just to survive, and a small rise in input costs can wipe out their profits entirely.
When you compare two companies, gross margin is one of the first things to look at. Two businesses with the same revenue but different gross margins are not the same kind of business at all. They face different competitive pressures, they have different paths to profitability, and they deserve different valuations.
Operating Expenses: Where the Real Business Logic Lives
Below gross profit, you encounter the operating expense lines. This is where you can see what kind of business the company is running — the choices it is making about where to spend the money it has available.
Research and Development (R&D) — Investments in building new products, improving existing ones, or advancing the company's technology. High R&D spend is characteristic of technology, pharmaceutical, and hardware companies. A business that is spending 20% of revenue on R&D is signaling that it believes in aggressive innovation as a path to future growth. A business that is spending 2% might be mature, or might be underinvesting in its own future.
Sales and Marketing (S&M) — Investments in acquiring and retaining customers. For subscription businesses and consumer brands, this is often the largest operating expense line. A high S&M spend can indicate either aggressive growth investment or a business model that requires constant customer acquisition to replace churn. Context matters.
General and Administrative (G&A) — The costs of running the company as an organization. Executive salaries, legal, accounting, HR, real estate, and so on. G&A should generally be a modest percentage of revenue. If G&A is ballooning while revenue is not, you are looking at a business that has lost discipline.
The ratio of these three categories tells you what the business is. A business where R&D dwarfs S&M is a product-first technology company. A business where S&M dwarfs R&D is a distribution and marketing company with a commoditized or well-understood product. A business where G&A dominates is either very early stage, in trouble, or has a broken cost structure.
You do not have to memorize specific ratios. You just have to get used to looking at them and asking: "Does this pattern of spending make sense for the kind of business I think this is?"
Operating Income and Operating Margin
Subtract operating expenses from gross profit, and you get operating income — the profit from the core business operations, before financial items and taxes.
Operating margin = Operating Income / Revenue
This is a critical metric. Operating margin tells you how much of every dollar of revenue actually flows down to the business's core profit, after all the costs of running the operation. A company with a 25% operating margin is deeply profitable. A company with a 5% operating margin is thin. A company with a -15% operating margin is losing money on its core operations.
What makes operating margin so useful is that it lets you compare fundamentally different businesses on a single axis. A software company with 30% operating margins and a manufacturing company with 12% operating margins and a retailer with 4% operating margins tell you everything you need to know about the different economic realities they face. Those different margin profiles translate almost directly into different valuation multiples in the stock market.
The Bottom Line
After interest expenses, other items, and taxes, you reach net income — the final profit attributable to the owners of the business. Net income is the number that shows up in headlines ("Apple earned $24 billion this quarter"). It is also the number used to calculate earnings per share, which is net income divided by the number of shares outstanding.
Net income matters, but it is also more easily distorted than the numbers above it. A company can have good operating income but poor net income because of a one-time tax adjustment. Or it can have a bad operating quarter but good net income because it sold off an asset at a gain. Experienced investors usually spend more time on operating income and operating margin than on net income, because operating income reflects the core business's performance without being distorted by financial engineering or one-off items.
This does not mean net income is useless. It is the ultimate measure of whether the business, as a total entity including all its financial structure, made money for its owners this period. But you should not stop there. You should always understand where the net income came from and whether it is representative of the underlying business.
What the Income Statement Does Not Tell You
This is as important as what the statement does tell you.
It does not tell you about cash. The income statement is calculated on an "accrual" basis, which means revenue is recognized when it is earned (even if the customer has not paid yet) and expenses are recorded when they are incurred (even if the bill has not been paid yet). A company can show strong net income on the income statement while actually running out of cash. This is why the cash flow statement exists — and why we cover it in Week 6.
It does not tell you about the balance sheet. The income statement tells you what the business earned, not what it owns or owes. A company can have excellent earnings and a dangerously over-leveraged balance sheet. Or weak earnings and a rock-solid financial position. You need the balance sheet to see the full picture — next week.
It does not tell you about quality. Two companies can report identical net income figures while one is compounding its competitive position and the other is quietly losing market share. The income statement summarizes results. It does not analyze them. That job is yours.
It does not tell you about the future. Every income statement is a historical record. It shows what already happened. Nothing on the statement tells you what will happen next quarter or next year. You use the patterns you see — growth rates, margin trends, spending discipline — to form judgments about the future, but those judgments are yours, not the statement's.
The income statement is a tool. A powerful one. But it is one tool among three, and none of them alone tells you what you need to know.
Reading an Income Statement in Practice
Let us make this concrete. Go to the investor relations website of any large public company — just search "[company name] investor relations." You will find a page with quarterly and annual reports. Open the most recent annual report (the 10-K). Scroll until you find the "Consolidated Statements of Operations" or "Consolidated Income Statement." This is the official, audited income statement for the company's most recent fiscal year, with the previous one or two years alongside it for comparison.
Work through it top to bottom. What was revenue? How much did it grow vs the previous year? What was the gross margin? Is that number higher, lower, or the same as last year's? What were the major operating expense categories and what do they suggest about how the business spends money? What was operating income and operating margin? How does net income compare to operating income — is there anything unusual between them?
Do this once. For any single company. It takes about twenty minutes. When you finish, you will know more about that company's actual business performance than 95% of the people who trade its stock.
This is not an exaggeration. Most retail investors never look at a single income statement. They trade based on price charts, news headlines, and other people's opinions. Reading one income statement carefully puts you ahead of most of the people trading in the same market. Reading them consistently, for companies you care about, is the single biggest edge a retail investor can build.
What You Should Do This Week
Read one income statement. Pick a company whose product you use. Go to their investor relations page. Open the most recent 10-K. Find the income statement. Work through it line by line with the structure we covered above.
Note three things. Write down (on paper or in a note app): the revenue growth rate, the gross margin, and the operating margin. Just those three numbers. These are your starting benchmarks.
Compare against a competitor. Pull up the same three numbers for a direct competitor. Now you have a comparison. You can see, with your own eyes, which business has the stronger economics on each dimension. This single exercise — comparing two real companies on the same three metrics — teaches more about investing than any number of stock-picking articles.
Looking Ahead
Next week: the balance sheet. If the income statement is what the business earned during a period, the balance sheet is what the business owns and owes at a single moment. The two statements answer different questions, and both matter.
The income statement shows you whether a business is a good business. The balance sheet shows you whether it can survive to keep being one.
Investing 101 — Beginner Series. Week 4 of 12.
Next week: Reading a Company (Part 2) — The Balance Sheet.
Educational content only. Not investment advice. Always do your own research.