Reading a Company (Part 2): The Balance Sheet
The income statement tells you what a business earned. The balance sheet tells you whether it can survive to keep earning. Here is how to read it.
Reading a Company (Part 2): The Balance Sheet
Last week you learned that the income statement tells the story of a business over a period of time — what came in, what went out, what was left. That is half the picture of a company's financial health. The other half is the balance sheet, and it answers a fundamentally different question.
The income statement asks: "How did the business perform during this period?"
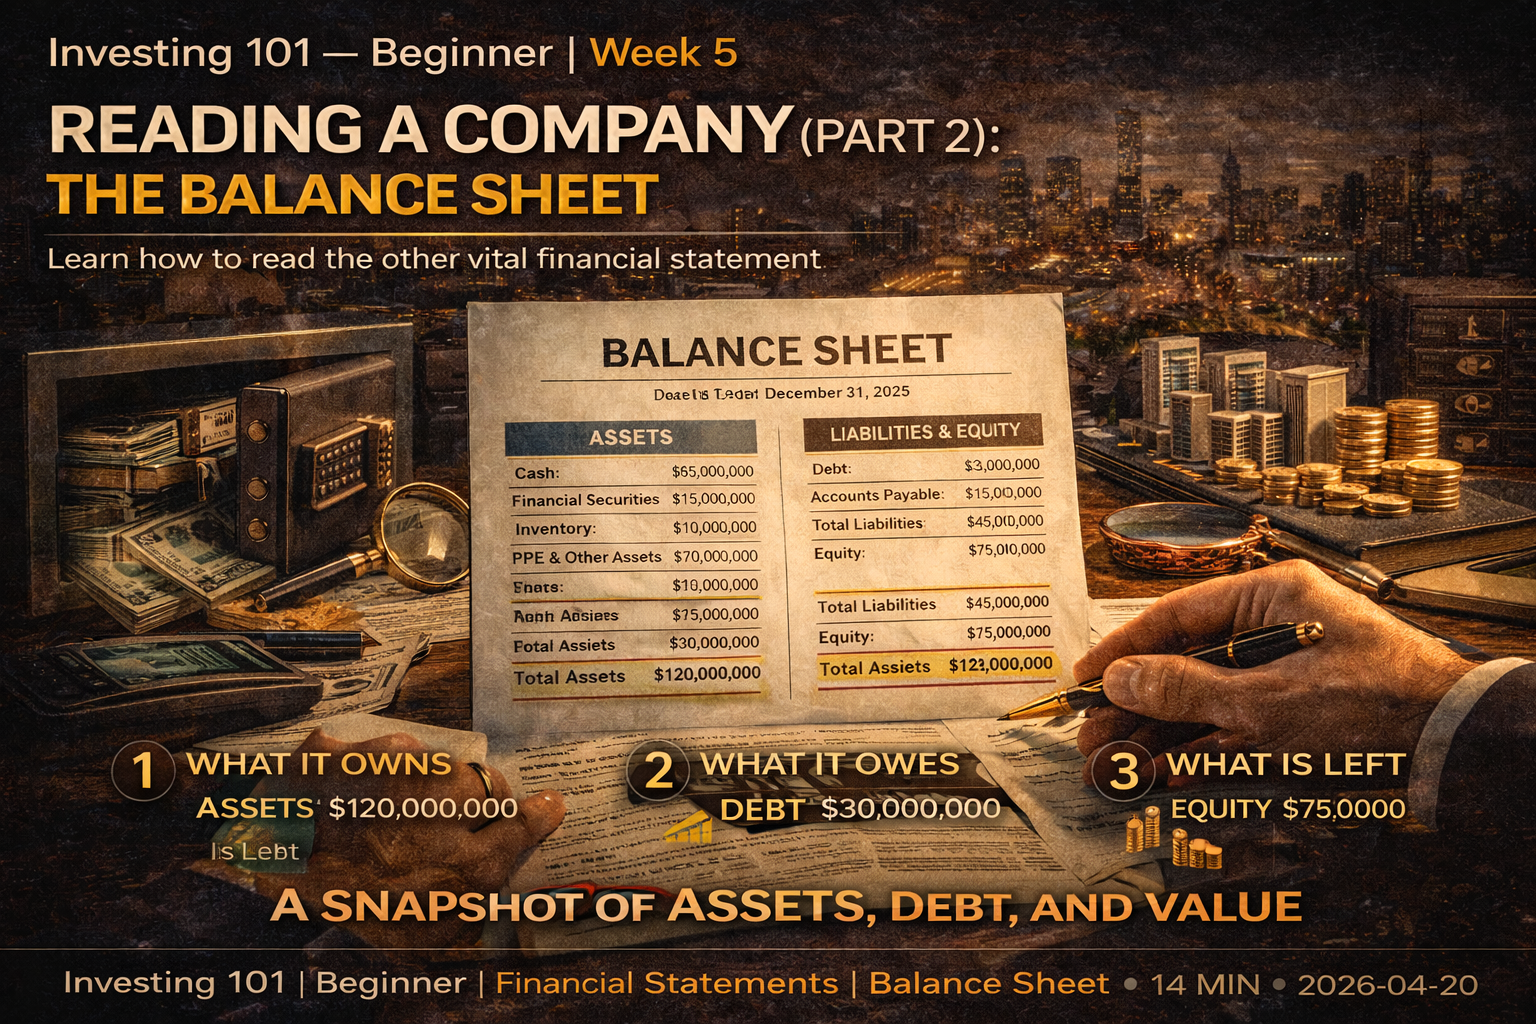
The balance sheet asks: "At this exact moment, what does the business own, what does it owe, and what is left for the owners?"
Both matter. A business can earn consistent profits while quietly accumulating dangerous debt. A business can lose money for years while sitting on a mountain of cash. The income statement would never tell you which situation you are in. Only the balance sheet does.
For many beginners, this is the financial statement that feels most foreign. But the underlying logic is simple — genuinely simple — and once it clicks, the balance sheet becomes one of the most revealing documents you can read about any company.
What the Balance Sheet Is
A balance sheet is a snapshot of everything a company owns and owes at a specific moment in time — usually the last day of a quarter or fiscal year.
The word "snapshot" is literal. The income statement covers a range of time ("what happened between January and December"). The balance sheet captures a single instant ("here is what we look like on December 31 at midnight"). The day before, the numbers would have been slightly different. The day after, they will be slightly different. The balance sheet freezes the frame.
This has an important implication. To understand a company's financial trajectory, you cannot look at just one balance sheet. You need to compare balance sheets across time. How did the cash position change over the year? Is debt going up or down? Is the company accumulating inventory that it cannot sell? These trends — the movement between snapshots — tell you far more than any single snapshot alone.
Like the income statement, the balance sheet is a mandatory part of every public company's quarterly and annual filings. You can find it in the same 10-K or 10-Q report, usually titled "Consolidated Balance Sheet" or "Consolidated Statement of Financial Position."
The Fundamental Equation
The entire balance sheet rests on one equation, and every balance sheet in the world — for every company, in every country, in every industry — obeys it without exception:
Assets = Liabilities + Shareholders' Equity
What a company owns (assets) is always equal to what it owes to others (liabilities) plus what belongs to the owners (equity). This is not an accounting convention or a rule of thumb. It is a logical identity. Everything a company has was financed by someone — either by borrowing (which creates a liability) or by owners putting in capital (which creates equity). There is nowhere else the money could have come from.
Rearranged, the equation gives you the most important single concept in corporate finance:
Shareholders' Equity = Assets − Liabilities
What belongs to the owners is what is left over after every debt is paid. This is the "book value" of the company. If you liquidated every asset at its recorded value and paid every creditor, this is what would remain for shareholders. Book value is not the same as market value — we will come back to that — but it is the closest thing to a "cost basis" that a whole company has.
The balance sheet is, from the first line to the last, just a detailed breakdown of this equation. Assets on one side. Liabilities and equity on the other. They always balance. That is why it is called a balance sheet.
Assets: What the Company Owns
Assets are anything the company owns or controls that has economic value. They are usually divided into two main categories based on how quickly they can be turned into cash.
Current assets are expected to be converted to cash within one year. These include:
- Cash and cash equivalents — The most liquid asset. Money in bank accounts, short-term government bonds, money market funds. This is the purest form of financial strength. A business with lots of cash can weather downturns, seize opportunities, and pay its bills. Watching the cash balance over time tells you whether the business is accumulating dry powder or burning through its reserves.
- Short-term investments — Marketable securities held for near-term uses. Essentially "cash one step removed."
- Accounts receivable — Money owed to the company by customers who have not yet paid. If you sell $100 of goods on 30-day terms, that $100 becomes revenue on the income statement and an accounts receivable on the balance sheet until the customer actually pays. Watch this line: if receivables are growing much faster than revenue, customers may be struggling to pay, or the company may be loosening credit terms to book sales that it will not collect on.
- Inventory — Goods the company has produced or purchased but has not yet sold. For a retailer or manufacturer, inventory is a huge line item. Growing inventory is a warning sign if revenue is not keeping up — it means products are piling up in warehouses and may eventually need to be discounted or written off.
Non-current assets (sometimes called long-term assets) are expected to provide value over multiple years. These include:
- Property, plant, and equipment (PP&E) — Physical long-lived assets. Buildings, factories, servers, machinery, land. For capital-intensive businesses — utilities, manufacturers, airlines — this is the largest asset category. The number reported is usually net of accumulated depreciation, meaning the original cost minus an annual charge that reflects aging and wear.
- Intangible assets — Non-physical assets with economic value. Patents, trademarks, brand value, customer relationships acquired through purchases. Intangibles are real, but they can be hard to verify independently and are often written down sharply if the underlying value turns out to be less than assumed.
- Goodwill — A specific accounting item created when a company acquires another company for more than its net asset value. The difference between the purchase price and the acquired assets becomes "goodwill" on the acquirer's balance sheet. A large goodwill balance tells you the company has been active in acquisitions. If the acquired businesses perform poorly, the company may have to write down goodwill, which hits earnings.
- Long-term investments — Stakes in other companies, long-duration bonds, and similar assets not meant to be sold in the near term.
The total of current and non-current assets is what the company owns. Now, against that, comes what the company owes.
Liabilities: What the Company Owes
Liabilities follow the same current/non-current split.
Current liabilities are debts or obligations that must be paid within one year. These include:
- Accounts payable — Money the company owes to its suppliers but has not yet paid. The mirror image of accounts receivable. A business that is stretching its payment terms (high or rising accounts payable) may be conserving cash — or may be struggling to pay its bills.
- Short-term debt — Loans, credit lines, or bond principal due within the next year.
- Accrued expenses — Costs that have been incurred but not yet paid. Salaries owed to employees for the last two weeks of the quarter. Utility bills that have arrived but are not yet due.
- Deferred revenue — Money the company has already collected from customers but has not yet delivered the corresponding product or service for. A software company that sells a one-year subscription and collects the full payment upfront will show that payment as deferred revenue until each month's service is delivered. Deferred revenue is a liability because the company owes something — not cash back, but the product or service it has been paid for.
Non-current liabilities are obligations that come due more than a year out. These include:
- Long-term debt — Bonds, mortgages, and loans with maturity beyond one year. For many businesses, this is the single largest liability line. It is also the line that most often separates sustainable businesses from fragile ones.
- Deferred tax liabilities — Taxes that will be owed in the future because of timing differences between book accounting and tax accounting.
- Pension obligations and other long-term commitments — Promises to pay retirees, provide benefits, or cover future costs.
The total of current and non-current liabilities is what the company owes. What remains — assets minus liabilities — is shareholders' equity, the ownership value.
Shareholders' Equity: What Belongs to the Owners
Shareholders' equity is the residual claim. After every creditor is paid, this is what remains for the owners. It has several components worth knowing:
- Common stock and additional paid-in capital — The original amount of money investors put into the company in exchange for shares. If a company sold a million shares at $10 in its IPO, this line captures the $10 million that investors contributed.
- Retained earnings — The cumulative profits the company has earned and not paid out as dividends. Every year a company earns a profit, it either pays that profit to shareholders as dividends or retains it to reinvest in the business. Retained earnings is the running total of all retained profits since the company was founded. A rising retained earnings line means the business is profitable and reinvesting; a falling one means either losses or large dividend payments.
- Treasury stock — Shares the company has bought back from the market. When a company does a share repurchase, those shares come off the public market and are held by the company itself. They show up as a negative number in equity, because they reduce the total shares outstanding and therefore the total claim on the business.
- Accumulated other comprehensive income — A technical line that captures certain gains and losses (foreign currency translations, unrealized investment gains) that do not flow through net income.
Add those components together and you get total shareholders' equity — the book value of the business from the owners' perspective.
The Ratios That Matter Most
Raw numbers on a balance sheet tell you less than ratios do. A company with $100 billion in assets sounds impressive until you learn it has $110 billion in liabilities. Here are the specific ratios that experienced investors watch most carefully, and what they reveal.
Current ratio = Current Assets / Current Liabilities
Can the company pay its short-term obligations with its short-term assets? A current ratio above 1.0 means yes, at least in theory. A ratio below 1.0 means the company has more bills coming due in the next year than it has liquid assets to pay them with — which does not guarantee trouble (the company may have other sources of cash coming in), but it is a warning sign. Healthy, well-capitalized companies typically have current ratios between 1.5 and 3.0.
Quick ratio = (Current Assets − Inventory) / Current Liabilities
A stricter version of the current ratio that excludes inventory, which is less easily converted to cash than actual cash or receivables. This is sometimes called the "acid test" because it reveals whether a company could pay its bills if it had to do so quickly, without selling down inventory at discount prices.
Debt-to-equity = Total Liabilities / Shareholders' Equity
How much of the company's capital structure is financed by borrowing versus ownership? A ratio of 1.0 means the company owes as much as it owns outright. A ratio of 3.0 means three times as much in debt as in equity. Different industries have very different norms — banks and utilities carry high debt-to-equity ratios structurally, while technology companies often operate with almost none. What matters is whether the ratio is appropriate for the industry and trending in a healthy direction.
Debt-to-assets = Total Liabilities / Total Assets
The percentage of everything the company owns that is financed by debt. This is an intuitive way to see leverage. A debt-to-assets ratio of 0.3 means 30% of the company's assets are financed by borrowing; 70% by owners. A ratio of 0.8 means 80% is financed by borrowing — the company is heavily leveraged, and a small downturn can wipe out equity entirely.
What a Healthy Balance Sheet Looks Like
You do not need industry expertise to recognize a healthy balance sheet. Here is what to look for:
Cash is growing or stable, not shrinking. A business that is steadily building cash reserves is in a much stronger position than one that is depleting them, regardless of what its income statement says.
Long-term debt is manageable relative to operating income. A useful shortcut: divide long-term debt by annual operating income. If the number is under 3, the company could theoretically pay off all its long-term debt in three years of operating profits — a comfortable position. If the number is over 6, the company is heavily indebted and a downturn in earnings could create serious problems.
Current assets exceed current liabilities by a reasonable margin. The current ratio should be safely above 1.0, and ideally above 1.5.
Retained earnings are growing. Positive and growing retained earnings mean the company is profitable and accumulating value for shareholders. A declining or negative retained earnings balance is a warning that the company has been losing money cumulatively or paying out more than it earns.
Goodwill is not wildly disproportionate. If goodwill is a large majority of the asset base, the company has been very acquisitive, and there is real risk of future impairments if those acquisitions underperform.
None of these conditions alone guarantees a good investment. Together, they describe a business with financial resilience — one that can survive mistakes, weather downturns, and keep compounding value over time.
What a Troubled Balance Sheet Looks Like
Equally useful: recognizing warning signs.
Cash is falling while debt is rising. The company is bleeding cash and borrowing to cover the gap. This is a slow-motion crisis. Eventually the debt comes due, and if the underlying business has not improved, the company cannot refinance.
Accounts receivable growing much faster than revenue. Customers are taking longer to pay, or the company is shipping goods to low-quality buyers just to book revenue. Either way, reported revenue may not turn into actual cash.
Inventory growing much faster than revenue. Products are accumulating faster than they are being sold. Discounts, writedowns, or both are likely coming.
Current liabilities exceeding current assets. A short-term solvency problem. The company needs to refinance, raise capital, or find another source of cash — and if the market is not willing to provide it, bankruptcy risk becomes real.
Negative shareholders' equity. Liabilities exceed assets. The company owes more than it owns. This happens either because of sustained losses eating away at retained earnings, or because of aggressive share buybacks funded with debt. Either way, it is a structurally weak position. Some profitable companies operate with negative equity due to years of buybacks (McDonald's and Starbucks have at various points) — but it is a specific condition that needs to be understood case by case, not dismissed.
The Limits of the Balance Sheet
Like the income statement, the balance sheet has important limits you should know about.
It does not capture the value of human capital. The skills of a great engineering team, a great sales organization, or a great CEO do not appear anywhere on a balance sheet. Some of the most valuable things a company owns — culture, talent, know-how — are literally invisible in the accounting.
It does not fully capture the value of intangibles. Brand strength, customer loyalty, network effects, and accumulated data are poorly reflected in accounting conventions. A company like Coca-Cola has a brand worth tens of billions of dollars that does not appear on its balance sheet in any recognizable form.
Asset values are historical, not current. Property and equipment are typically recorded at cost minus depreciation, not at current market value. A piece of Manhattan real estate bought in 1970 for $1 million still shows up on the balance sheet near that figure, even if it is actually worth $50 million today. This means book value often understates true underlying value for companies with long-held real assets.
It is a single moment in time. You cannot see trends from one snapshot. You need to look at balance sheets across multiple periods to understand trajectory.
The balance sheet is not the whole truth. It is, however, the most honest single document the company produces about its financial condition — because every number on it has to reconcile with specific, verifiable legal realities (you either owe this debt or you do not; you either own this property or you do not) in a way that income statement items sometimes do not.
What You Should Do This Week
Pull up a balance sheet. Same company you looked at last week. Same 10-K. Find the "Consolidated Balance Sheet" section.
Note the basics. Write down: total assets, total liabilities, total shareholders' equity, cash position, and long-term debt. Just those five numbers.
Calculate two ratios. Current ratio (current assets divided by current liabilities) and debt-to-equity (total liabilities divided by shareholders' equity). You now have two concrete measures of financial health.
Compare across time. Most 10-K filings show the balance sheet for the two most recent fiscal years side by side. Look at how each number changed. Is cash growing or shrinking? Is debt growing or shrinking? Is shareholders' equity growing? These trends are usually more informative than the absolute numbers.
Compare against the competitor. Same competitor you used last week. Same five numbers, same two ratios. You are now looking at two companies through the same lens. The contrast will be revealing.
Looking Ahead
Next week: the cash flow statement — the third and final financial statement. If the income statement is about earnings and the balance sheet is about financial position, the cash flow statement is about something very specific and underappreciated: how cash actually moves through the business.
A business can report profits and still run out of cash. A business can report losses and still generate cash. The cash flow statement is where those realities get reconciled. It is, for serious investors, often the most important of the three.
Investing 101 — Beginner Series. Week 5 of 12.
Next week: Reading a Company (Part 3) — The Cash Flow Statement.
Educational content only. Not investment advice. Always do your own research.