Reading a Company (Part 3): The Cash Flow Statement
Profits can be engineered. Assets can be revalued. Cash cannot lie. The cash flow statement is where the truth about a business finally shows up.
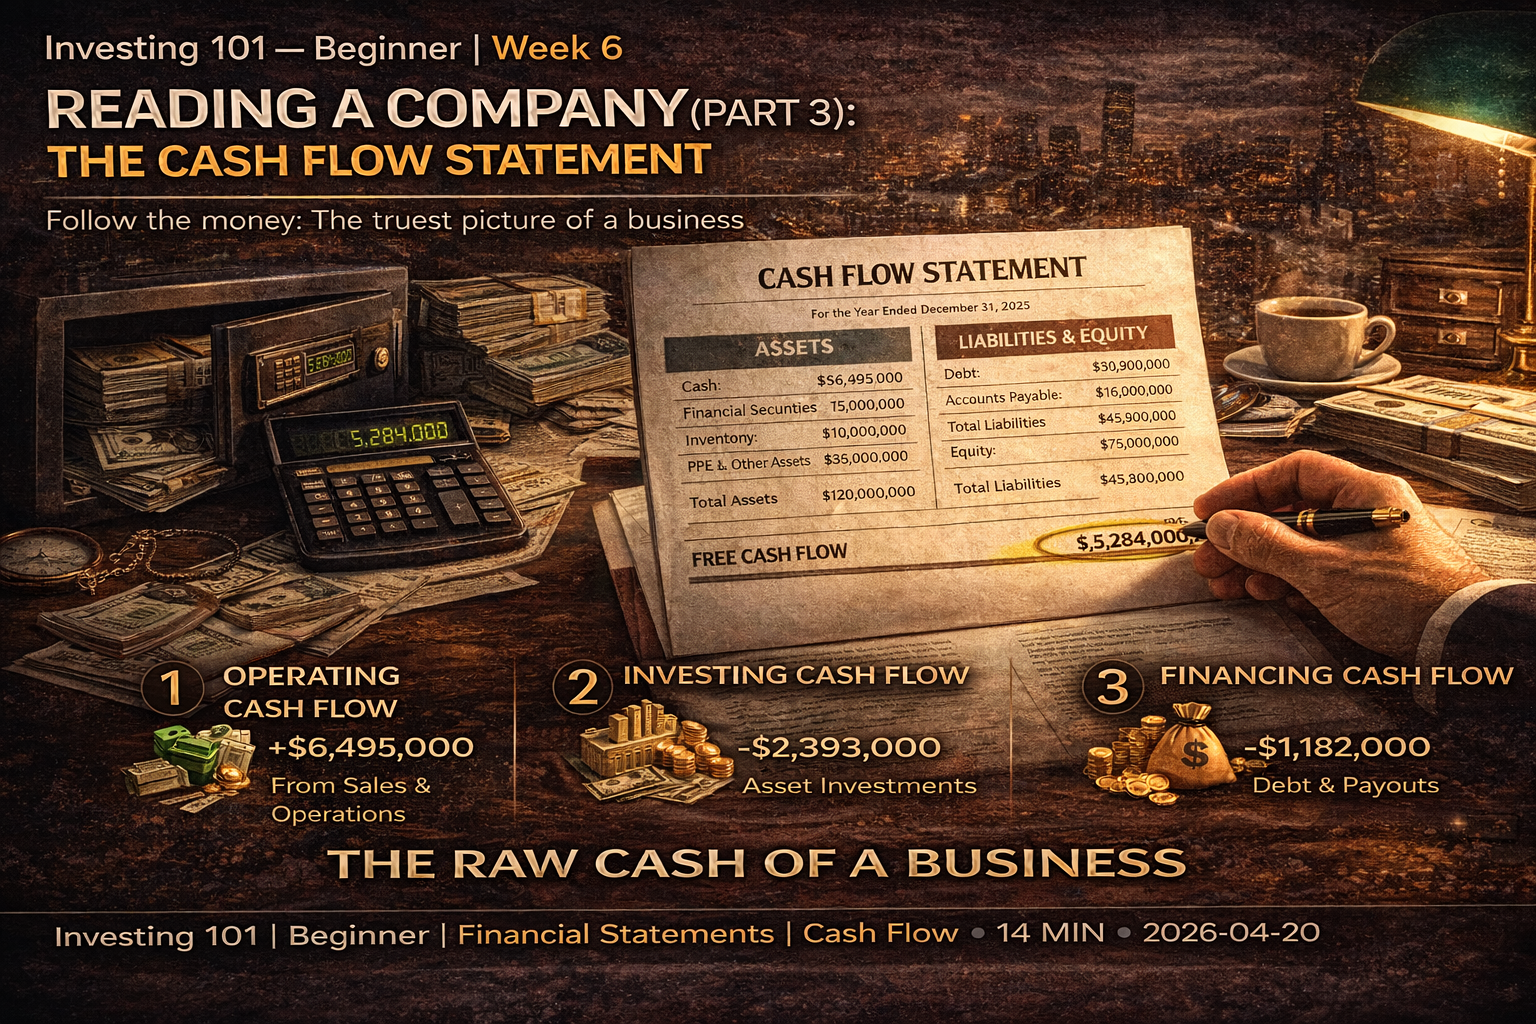
Reading a Company (Part 3): The Cash Flow Statement
Here is something that surprises almost every new investor when they first encounter it: a company can report massive profits and still go bankrupt. Another company can report years of losses and generate enormous wealth for its owners.
How is that possible?
The answer is the gap between accounting profit and actual cash. The income statement you learned to read in Week 4 is calculated on an accrual basis, which means revenue gets recognized when it is earned and expenses get recognized when they are incurred — regardless of whether money has actually changed hands. This is useful for understanding business activity. It is also a place where judgment, timing choices, and sometimes outright manipulation can create a picture that does not match reality.
The balance sheet you learned to read in Week 5 tells you what the business owns and owes, but at a single moment. It does not tell you how the cash is moving through the business day after day.
The cash flow statement is the third document, and for many serious investors it is the most important of the three. It answers a question the other two cannot answer cleanly:
Where is the cash actually coming from, and where is it going?
Cash is not an opinion. You either have it or you do not. You either received it this quarter or you did not. You either paid it or you did not. Profits can be smoothed, restated, and engineered. Cash, in the end, is cash. The cash flow statement is the document where the truth about a business most reliably surfaces.
What the Cash Flow Statement Is
The cash flow statement shows, over a period of time, every major source and use of cash in the business. Like the income statement, it covers a quarter or a year. Unlike the income statement, it is strictly about money physically moving in and out.
It takes the accrual-based income statement as its starting point and then makes a series of adjustments to answer the question: after all the accounting treatments are stripped away, what actually happened to the cash?
The statement is divided into three sections, each covering a different category of cash movement. Together, they account for every dollar that went in or out of the business's bank accounts during the period.
The Three Sections
1. Cash from Operating Activities — Cash generated or consumed by the core business of the company. Selling products, paying employees, collecting from customers, paying suppliers. This is the engine room. If the core operations are healthy, they generate cash. If they are not, they consume it.
2. Cash from Investing Activities — Cash spent on or received from long-term investments. Buying equipment. Building a factory. Acquiring another company. Selling an old business unit. This section shows where the company is putting its capital to build future earning power — or where it is liquidating to raise cash.
3. Cash from Financing Activities — Cash flowing between the company and its capital providers. Borrowing from banks or repaying loans. Issuing new shares or buying back existing ones. Paying dividends. This section shows how the company is managing its capital structure.
Add all three sections together, and you get the net change in cash for the period. Add that change to the starting cash balance, and you get the ending cash balance — which must match what is reported on the balance sheet. This is a consistency check that anchors everything.
Let us take each section in detail.
Cash from Operating Activities
This is the most important section. It tells you whether the core business is actually producing cash.
The section typically starts with net income — the bottom line of the income statement — and then adjusts for all the non-cash items and timing differences. The adjustments fall into several categories:
Depreciation and amortization — These are expenses on the income statement that reflect the gradual using-up of long-lived assets (depreciation for physical assets, amortization for intangibles). They reduce reported profit, but they are not cash outflows in the current period — the cash was spent when the asset was originally purchased. So they get added back.
Stock-based compensation — When a company pays employees in shares instead of cash, the value of those shares is recorded as an expense on the income statement, even though no cash left the company. It gets added back here. Stock-based compensation is economically real — it dilutes existing shareholders — but it is not a cash expense in the current period.
Changes in working capital — Working capital is the day-to-day cash tied up in running the business. This includes accounts receivable, inventory, accounts payable, and similar items. If receivables grew during the period, that means customers owe more than they did before — cash was "tied up" and did not yet arrive. If inventory grew, cash was spent on buying or making products that have not yet been sold. If accounts payable grew, the company is holding onto cash it owes to suppliers — a source of cash in the short term. Each of these timing differences gets captured as an adjustment.
The result, at the bottom of this section, is cash flow from operations. For a healthy business, this number should generally exceed net income, because of depreciation being added back. A business whose operating cash flow is consistently lower than reported net income is worth examining carefully — it often means the accounting profits are not converting to real cash.
This is arguably the single most important number on the entire cash flow statement. Operating cash flow tells you whether the core business is self-funding or capital-hungry, whether it can sustain itself or requires continuous outside support.
Cash from Investing Activities
This section shows how the company is deploying its long-term capital.
The most important line here is usually capital expenditures (often abbreviated CapEx) — money spent on physical assets that will serve the business for years. New factories, new servers, new vehicles, new buildings. CapEx is almost always a cash outflow, appearing as a negative number.
Other lines in this section include:
- Acquisitions — Cash paid to buy other businesses.
- Divestitures — Cash received from selling parts of the business.
- Purchases and sales of investments — Money moved into or out of marketable securities and strategic investments.
For most operating companies, the investing section is dominated by CapEx, and CapEx is usually a net outflow. The business is spending money to maintain and grow its productive capacity. That is normal and healthy. What matters is the relationship between operating cash flow and CapEx, which gives you free cash flow — the most watched metric in all of investment analysis.
Free Cash Flow: The Metric That Matters Most
Here is the calculation that experienced investors watch more closely than almost any other number:
Free Cash Flow (FCF) = Cash from Operations − Capital Expenditures
This is the cash the business generates after investing what it needs to maintain and grow its operations. It is the cash that is actually available to shareholders, either to be returned through dividends and buybacks or reinvested in acquisitions or kept as a cushion.
Free cash flow is the purest measure of a business's economic productivity. A company that generates consistent, growing free cash flow is a business that is genuinely creating value. A company whose free cash flow is chronically negative is a business that is consuming more capital than it produces — which may be fine for a young company investing for growth, but is a red flag for a mature company.
When Warren Buffett talks about "owner earnings" or when analysts talk about "cash generating power," free cash flow is usually what they mean. It strips away accounting choices, removes the effects of working capital timing, and gets down to the essential question: how much real cash did this business produce that is available to its owners?
A useful exercise: go find the free cash flow of any company you are considering investing in. Look at it over the past five to ten years. Is it growing? Shrinking? Volatile? Stable? This single time series tells you more about the economics of the business than any number of marketing materials or analyst reports.
Cash from Financing Activities
This is the section that shows how the company is managing its capital structure — its relationship with lenders and shareholders.
Common lines in this section:
- Issuance of debt — Cash received from borrowing. Positive number.
- Repayment of debt — Cash used to pay down loans. Negative number.
- Issuance of stock — Cash received from selling new shares. Positive number. Dilutes existing shareholders.
- Repurchase of stock — Cash used to buy back shares. Negative number. Concentrates ownership among remaining shareholders.
- Dividends paid — Cash distributed directly to shareholders. Negative number.
The financing section is where you see the company's capital allocation decisions most clearly. Is management returning cash to shareholders through dividends and buybacks? Or are they raising fresh capital by issuing shares and debt? Are they growing the balance sheet by adding leverage, or shrinking it by paying down debt?
A mature, profitable business usually shows consistent negative cash flow from financing — meaning it is paying dividends and buying back shares with the cash its operations generate. A growing business may show positive cash flow from financing as it raises capital to expand. Neither pattern is automatically good or bad — what matters is whether the pattern fits the stage and strategy of the business.
Watch carefully for companies whose operating cash flow is weak but financing cash flow is positive year after year. That is a business covering operational shortfalls by borrowing or issuing shares. Sustainable only for so long.
The Patterns That Tell You Everything
Once you have learned to read the three sections individually, the real insight comes from seeing how they interact. Here are the most important patterns to recognize.
Healthy mature business: Operating cash flow is strongly positive and exceeds net income. Investing cash flow is moderately negative (mostly CapEx to maintain operations). Financing cash flow is negative (paying dividends and buybacks). The business generates cash, reinvests some, returns the rest to shareholders. This is the financial signature of a compounding machine.
Healthy growth business: Operating cash flow is positive but may be modest relative to net income. Investing cash flow is deeply negative (heavy CapEx to expand capacity). Financing cash flow may be positive (raising capital to fund growth). Free cash flow is modest or negative — but for legitimate, value-creating reasons.
Troubled business with declining reality: Net income looks decent, but operating cash flow is consistently weaker — meaning accounting profits are not converting to cash. Financing cash flow is positive through borrowing. The balance sheet debt grows year after year. Dividends may even be paid from borrowed money. This is a slow-motion failure disguised by accounting metrics, and it is a pattern you will see over and over in businesses that eventually collapse.
Financial engineering without substance: Operating cash flow is flat or declining. Investing cash flow shows minimal CapEx — the company is not reinvesting. Financing cash flow shows massive share buybacks funded by issuing debt. Earnings per share may be rising because share count is falling, but the underlying business is not growing. The stock looks good by headline metrics while the real business decays underneath.
Learning to recognize these patterns is the single highest-value skill the cash flow statement teaches. The income statement alone cannot show you the difference between a compounding business and a declining one dressed up to look the same. The cash flow statement usually can.
Why Cash Is Harder to Fake
This is worth making explicit, because it explains why serious investors trust the cash flow statement more than the other two.
Revenue can be inflated by recognizing sales that should not yet be recognized, or by shipping products to channel partners who may return them. Net income can be massaged by adjusting depreciation schedules, capitalizing expenses that should be expensed, or writing down assets in lumpy ways. Asset values on the balance sheet can be overstated if management is slow to recognize impairments.
Cash is different. Cash flow from operations — especially when you cross-check it against the change in the bank balance on the balance sheet — is extremely hard to fabricate over any sustained period. If the company reports it earned $500 million in operating cash flow this year, that cash has to actually exist somewhere. In a bank account. In short-term investments. Somewhere verifiable.
This is not to say cash flow statements are immune to manipulation. Aggressive reclassification of expenses, timing games with working capital, and creative definitions of "non-recurring" items can all distort the picture. But the scope for distortion is much narrower than with the income statement, and the distortions are much easier to detect when you compare cash flow trends to reported earnings over multiple years.
If net income is rising steadily while operating cash flow is flat or declining, something is wrong. You may not immediately see what, but the gap itself is a red flag worth investigating. Almost every major accounting scandal of the past thirty years would have been visible in this exact pattern to anyone who was watching.
The Relationship Between the Three Statements
All three financial statements are connected, and understanding the connections makes each one clearer.
The income statement produces net income. That number flows into two places: the cash flow statement (as the starting point for cash from operations) and the balance sheet (as an addition to retained earnings).
The balance sheet shows the cumulative effect of all past operating activity, all past investing activity, and all past financing activity. The cash balance at the end of the period on the balance sheet equals the cash balance at the start plus the net change reported on the cash flow statement. Every asset and liability has a connection to transactions captured on the income statement or cash flow statement.
The cash flow statement is the bridge. It takes the income statement (which is accrual-based) and reconciles it to the changes in the balance sheet (which captures the actual financial position). It is literally the document that shows how business activity translates into financial position.
You can read each statement in isolation and get useful information. But the real analytical power comes from reading all three together, tracing how net income becomes cash, how cash becomes assets and liabilities, and how all of it compounds over time into the business's overall financial trajectory.
What You Should Do This Week
Pull up the cash flow statement. Same company you have been working with for two weeks. Same 10-K. Find the "Consolidated Statement of Cash Flows."
Identify the three sections. Operating, investing, financing. Confirm that the net change equals the change in the cash balance on the balance sheet.
Calculate free cash flow. Cash from operations minus capital expenditures. Just those two lines subtracted. You now have one of the most important numbers in investment analysis for this company.
Compare free cash flow to net income. Over the past several years if the data is available. Are they moving together, or has a gap opened up? A consistent gap is a signal worth understanding.
Look at the financing section. Is the company paying dividends? Buying back shares? Issuing debt? Repaying debt? Issuing new shares? What does the pattern tell you about how management thinks about capital allocation?
Closing the Financial Statements Arc
Three weeks, three statements. You now have the core tools to read any public company in the world.
Most retail investors never learn these three documents. They trade on charts, news, and social media. What you have learned in the past three weeks puts you ahead of a huge portion of the market — not because you have insider information or superior models, but because you have the basic literacy to understand what you own when you own a share of a business.
This literacy does not make you a great investor by itself. You will need to add judgment, patience, and emotional discipline. But it makes great investing possible. Without it, every decision you make is based on superficial inputs, and every successful outcome is essentially luck.
The statements are the foundation. Everything else — business models, valuation, portfolio construction — builds on top of them.
Looking Ahead
Next week we shift from reading financial statements to thinking about business models. Financial statements tell you what a business did. Business model analysis tells you why it did that, and whether it can continue. What is the actual engine generating those numbers? How does the company make money? Why do customers buy? Why do they stay? What stops competitors from taking it all away?
The numbers are the output. The business model is the machine that produces them. Both matter, and understanding the relationship between them is where real investment thinking begins.
Investing 101 — Beginner Series. Week 6 of 12.
Next week: What Is a Business Model?
Educational content only. Not investment advice. Always do your own research.