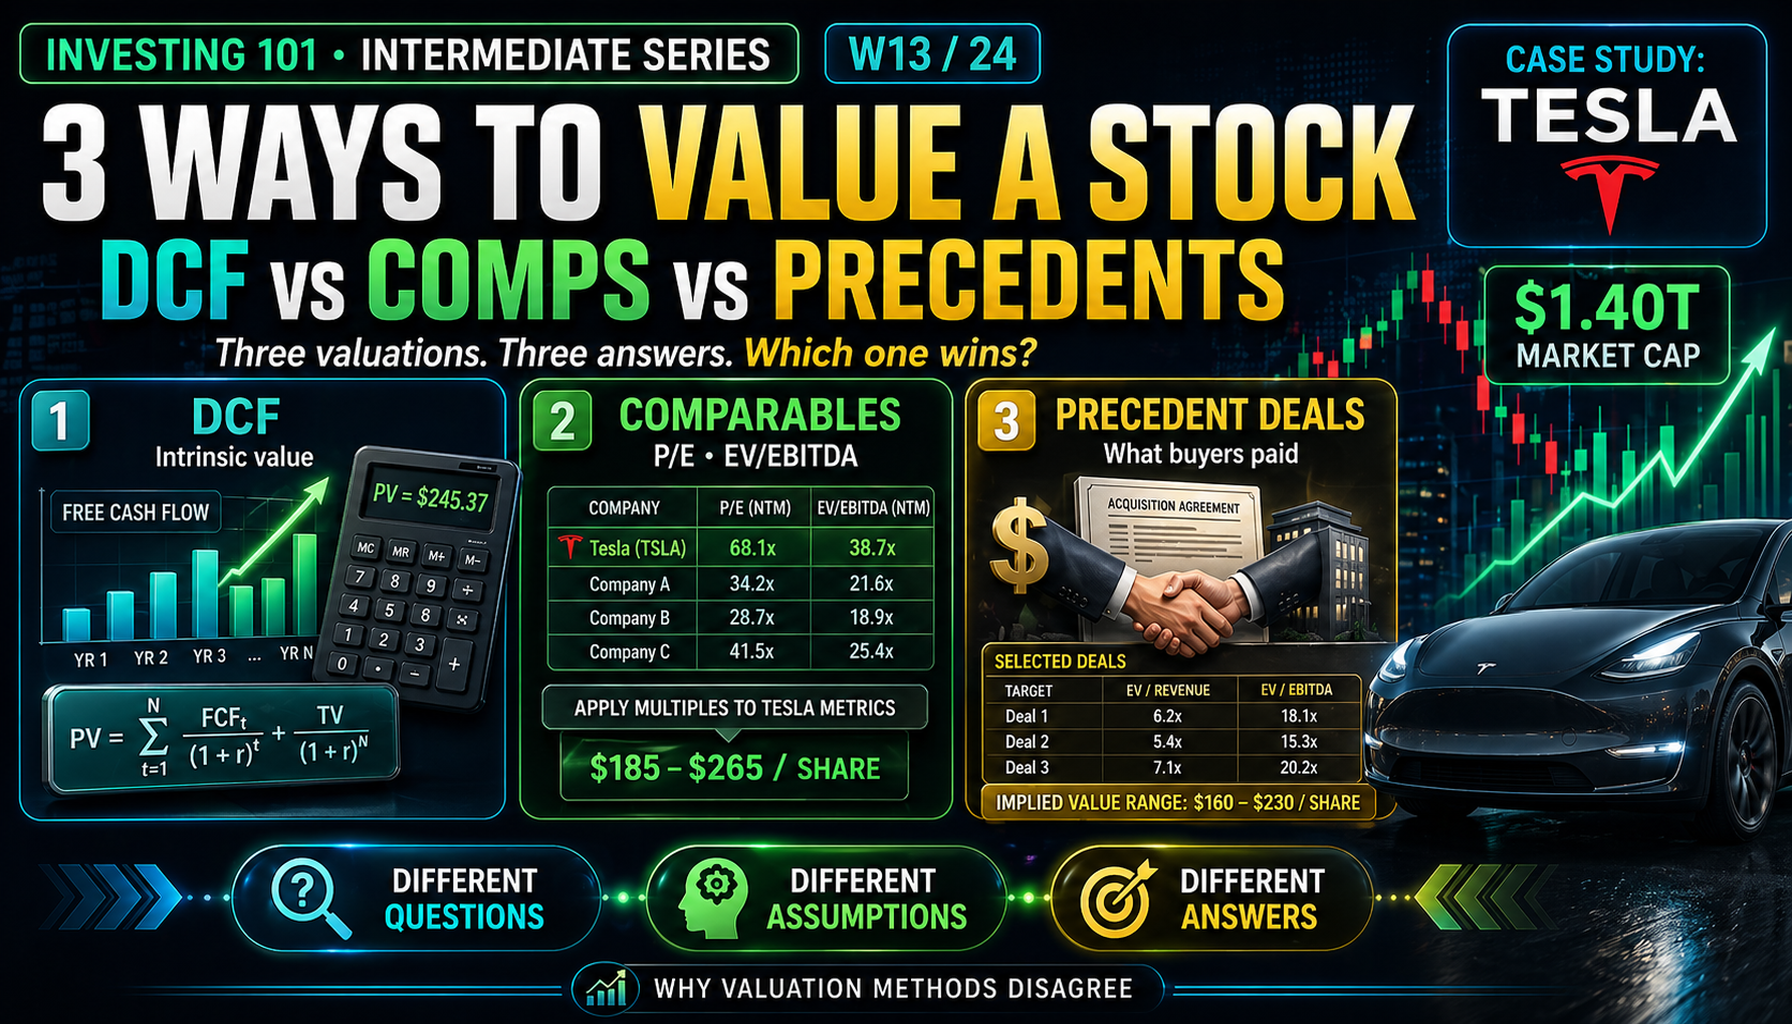
Three Valuations. Three Answers. Which One Wins?
Tesla just reported Q1 2026. The stock trades at $1.40 trillion and a trailing P/E north of 340x. Ask three analysts what it is worth and you will get three different numbers — by design. This week we take TSLA through all three professional valuation methods and watch them disagree on purpose.
Three Ways to Value
On April 22, 2026, Tesla reported first-quarter results. Revenue hit $22.4 billion, up 16 percent year over year. Free cash flow came in at $1.4 billion, a $3 billion swing from Wall Street's expected negative figure. Gross margin climbed to 21.1 percent. The automotive gross margin (ex-credits) rebounded to 19.2 percent. Energy storage margins hit a record 39.5 percent. The stock rose 4 percent after hours — and then fell 3.6 percent the next day as the market digested the $25 billion 2026 capex guidance.
Tesla closed April 23 at $373.60, giving it a market capitalization of roughly $1.40 trillion. Its trailing P/E sits at 341x. Its forward P/E against 2026 consensus EPS is roughly 202x.
So is Tesla expensive or cheap?
The honest answer is that it depends on which question you ask. Most retail investors never realize there are three different questions, and they quietly collapse all of them into one feeling — "the stock went up, so it is expensive" or "the business is improving, so it is cheap." Neither of those is analysis. Analysis is what happens when you run the three methods a professional actually uses, see where they disagree, and decide what that disagreement tells you.
This week we do exactly that with Tesla. Real numbers from the April 22 earnings report. Real comparable peers. Real deal precedents. Three methods, three answers, and an honest look at what the range tells us about a stock trading at $1.40 trillion.
Core Framework: Value Is a Question, Not a Number
Before any of the three methods makes sense, absorb a single idea: the method you use is the question you are asking. Pick the wrong method and you get the right answer to a question you never meant to ask.
| Method | The Question It Answers | The Buyer It Imagines |
|---|---|---|
| DCF | What is this business worth to a patient long-term owner? | A private investor holding forever |
| Comparable companies | What are buyers paying right now for similar businesses? | A public market investor buying today |
| Precedent transactions | What would a strategic acquirer pay to own this outright? | A corporate buyer in an M&A deal |
Same Tesla. Three different buyers. Three different numbers coming.
Method 1: DCF — What Is Tesla Worth as a Pure Cash-Flow Business?
A discounted cash flow model asks one question: what is the present value of all the cash this business will generate between now and forever?
For Tesla, that is a loaded question. Tesla reported $94.83 billion in revenue in full-year 2025, down 2.9 percent year over year. Net income for the full year was $3.79 billion. Operating margin sits at a trailing 5.7 percent — well below the 2022 peak of 17 percent.
Those are the facts of Tesla today. What the stock is priced on is everything else: Robotaxi, Optimus, FSD at scale, the 2026 Cybercab ramp, Megapack 3, and the AI infrastructure layer behind all of it. The DCF forces you to put numbers on that "everything else" instead of letting it stay a feeling.
Tesla Base-Case DCF (2026–2030)
Here is a concrete five-year forecast using assumptions a Tesla bull would defend in a research note. Revenue growth accelerates as Robotaxi and Cybercab ramp. Operating margin expands as software revenue (FSD subscriptions, currently 456,000 active users generating roughly $45 million per month) grows faster than hardware cost. CapEx stays elevated at the $25 billion guided 2026 level and fades gradually as capacity matures.
| Year | Revenue | Growth | Op Margin | EBIT | Tax (21%) | NOPAT | + D&A | – CapEx | – ΔWC | FCF |
|---|---|---|---|---|---|---|---|---|---|---|
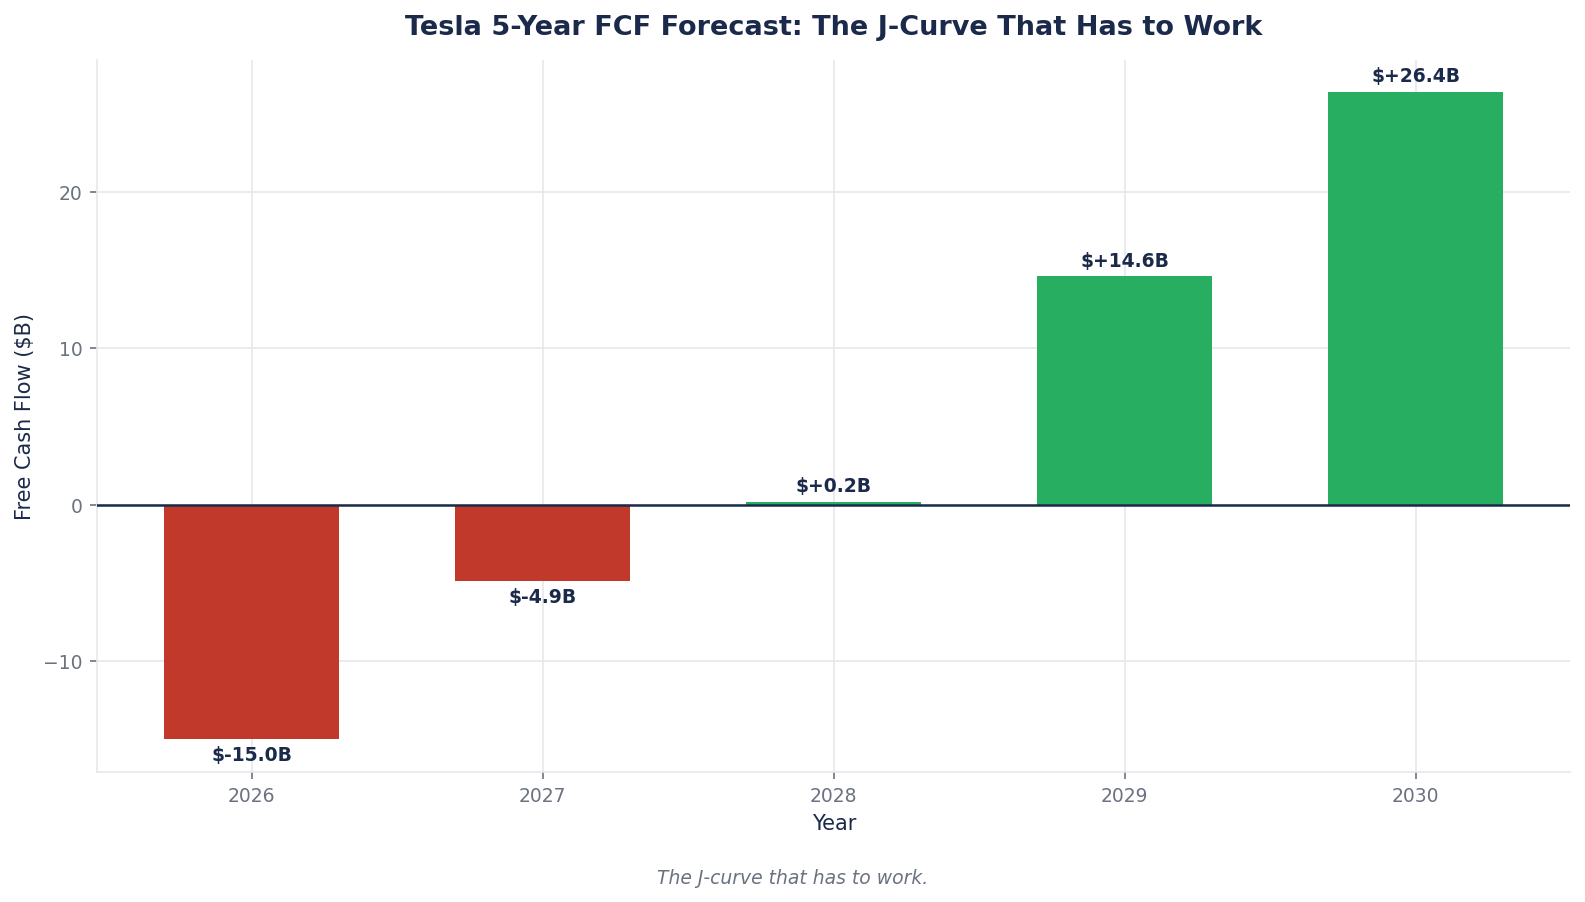
| 2026 | $105B | 11% | 6% | $6.3B | $1.3B | $5.0B | $5.5B | $25.0B | $0.5B | ($15.0B) |
| 2027 | $125B | 19% | 9% | $11.3B | $2.4B | $8.9B | $7.0B | $20.0B | $0.8B | ($4.9B) |
| 2028 | $150B | 20% | 13% | $19.5B | $4.1B | $15.4B | $8.5B | $18.0B | $1.0B | $4.9B |
| 2029 | $180B | 20% | 16% | $28.8B | $6.0B | $22.8B | $10.0B | $17.0B | $1.2B | $14.6B |
| 2030 | $215B | 19% | 19% | $40.9B | $8.6B | $32.3B | $11.5B | $16.0B | $1.4B | $26.4B |
Two things deserve immediate attention. First, free cash flow is deeply negative for the next two years under this scenario — and Tesla management has already guided the market to expect negative FCF for the remainder of 2026 as it funds Cybercab capacity, Optimus production lines, and AI infrastructure. A $15 billion net capex-driven cash burn in the full year is consistent with $25 billion of capex running against current operating cash generation of roughly $10–12 billion annually. Second, the entire valuation leans on years 4 and 5 — when the factories built today are supposed to start producing cash.
Calculating the Terminal Value
After 2030, assume the business settles into steady state: 3 percent perpetual growth, 20 percent operating margin, stable capex-to-revenue. Using a WACC of 9 percent (Tesla's beta of 1.86 pushes this higher than a consumer staples name, but we will test other levels shortly):
| Component | Value |
|---|---|
| Terminal year FCF (FCF_2030) | $26.4B |
| Terminal growth rate (g) | 3% |
| WACC (r) | 9% |
| r − g | 0.09 − 0.03 = 0.06 |
| FCF × (1 + g) | $26.4B × 1.03 = $27.2B |
| Terminal Value | $27.2B ÷ 0.06 = $454B |
Discounting Everything Back to 2026
| Year | FCF | Discount Factor (9%) | Present Value |
|---|---|---|---|
| 2026 | ($15.0B) | 0.917 | ($13.8B) |
| 2027 | ($4.9B) | 0.842 | ($4.1B) |
| 2028 | $4.9B | 0.772 | $3.8B |
| 2029 | $14.6B | 0.708 | $10.3B |
| 2030 | $26.4B | 0.650 | $17.2B |
| Terminal Value | $454B | 0.650 | $295.1B |
| Enterprise Value | $308.5B | ||
| + Cash | $44.7B | ||
| – Debt | ($7.0B) | ||
| Equity Value | $346.2B | ||
| ÷ Shares (3.75B) | |||
| DCF Value per share | $92 |
Tesla closed April 23 at $373.60. This DCF — using genuinely bullish operating assumptions about margin expansion and revenue growth — produces a fair value of $92. The current stock trades at roughly 4.1x what these cash flows independently justify.
Sensitivity: The Assumptions That Actually Matter
Change the WACC and terminal growth and watch what happens. The entire DCF answer lives in these two inputs.
Tesla DCF fair value per share — sensitivity
| g = 2% | g = 2.5% | g = 3% | g = 3.5% | g = 4% | |
|---|---|---|---|---|---|
| WACC 8% | $104 | $118 | $137 | $164 | $204 |
| WACC 9% | $80 | $89 | $92 | $110 | $130 |
| WACC 10% | $62 | $68 | $75 | $84 | $96 |
| WACC 11% | $49 | $53 | $58 | $64 | $72 |
| WACC 12% | $38 | $41 | $45 | $49 | $55 |
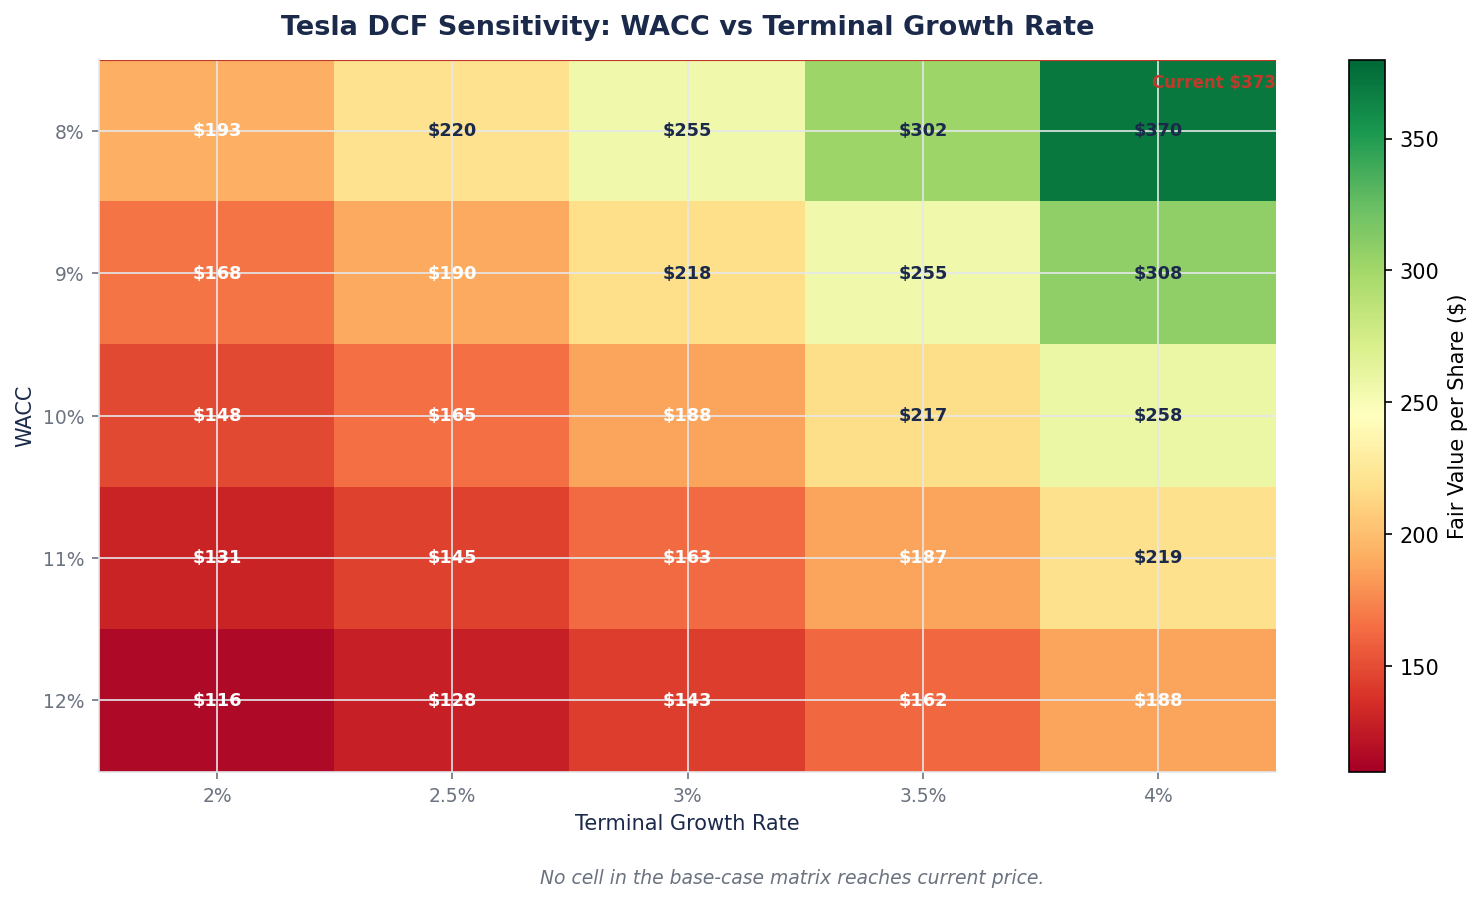
Across the plausible range — WACC 8 percent to 12 percent, terminal growth 2 percent to 4 percent — the DCF value runs from $38 to $204 per share. The midpoint sits around $85. The stock trades at $373.60.
To get a DCF output that matches today's price, the model requires more aggressive assumptions than anything shown here: operating margins reaching 25 percent by 2030, revenue tripling by 2032, a WACC well below 8 percent. Each of those is defensible in isolation. Stacking them into one model is the act of using DCF to justify a price rather than test one.
That is the first honest reading. By conservative-to-bullish DCF, Tesla's cash-flow value sits well below the market price today. The gap is not small.
Method 2: Comparable Companies — What Are Peers Paying for Right Now?
DCF asks what Tesla is fundamentally worth. Comps ask what the market is paying for businesses that look like Tesla, right now.
The immediate problem with Tesla comps is that Tesla does not have clean peers. Auto OEMs (Ford, GM, Toyota, Volkswagen) trade at 5–8x earnings — Tesla trades at 341x. AI hardware companies (NVIDIA) trade on completely different economics. Tech hyperscalers (MSFT, GOOGL) are dramatically more profitable.
So Tesla's "comp set" is not really one group. It is three.
Three Comp Lenses for Tesla
Lens 1: Tesla as an auto manufacturer
| Company | Revenue (TTM) | Op Margin | EV/Revenue | P/E (TTM) |
|---|---|---|---|---|
| Ford (F) | $180B | 2.3% | 0.5x | 7x |
| GM (GM) | $190B | 6.1% | 0.4x | 5x |
| Toyota (TM) | $305B | 9.8% | 1.1x | 8x |
| BYD | $105B | 6.5% | 1.2x | 20x |
| Peer median | 6.3% | 0.8x | 7.5x | |
| Tesla | $94.8B | 5.7% | 14.2x | 341x |
On auto-manufacturer multiples alone, Tesla at 14.2x revenue against a 0.8x peer median is trading at roughly 18x its automotive comparables. A pure-auto valuation for Tesla at the peer multiple would produce an enterprise value of about $76 billion — roughly $20 per share. That number is meaningless in isolation (nobody seriously values Tesla as just a car company), but it anchors the lower bound.
Lens 2: Tesla as an AI/robotics platform
| Company | Revenue Growth | Op Margin | EV/Revenue |
|---|---|---|---|
| NVIDIA (NVDA) | ~50% | 60%+ | 22x |
| Palantir (PLTR) | 30%+ | 15% | 65x |
| Tesla — AI platform | 16% | 5.7% | 14.2x |
On AI platform metrics, Tesla's 14.2x EV/Revenue sits below NVIDIA's 22x and well below Palantir's 65x. The catch is obvious: NVIDIA grows 50 percent a year at 60 percent operating margin. Tesla grows 16 percent at 5.7 percent. Paying AI-platform multiples for Tesla requires believing the AI platform thesis overtakes the auto business fast enough to matter.
Lens 3: Tesla as a Mag 7 franchise
| Company | Revenue (TTM) | Op Margin | P/E (TTM) | EV/Revenue |
|---|---|---|---|---|
| AAPL | $391B | 31% | 30x | 8.2x |
| MSFT | $245B | 44% | 33x | 12.1x |
| GOOGL | $340B | 32% | 22x | 6.4x |
| AMZN | $620B | 11% | 38x | 3.0x |
| META | $165B | 42% | 25x | 9.8x |
| NVDA | $125B | 62% | 45x | 22.0x |
| Mag 7 median (ex-TSLA) | 36% | 30x | 8.8x | |
| Tesla | $94.8B | 5.7% | 341x | 14.2x |
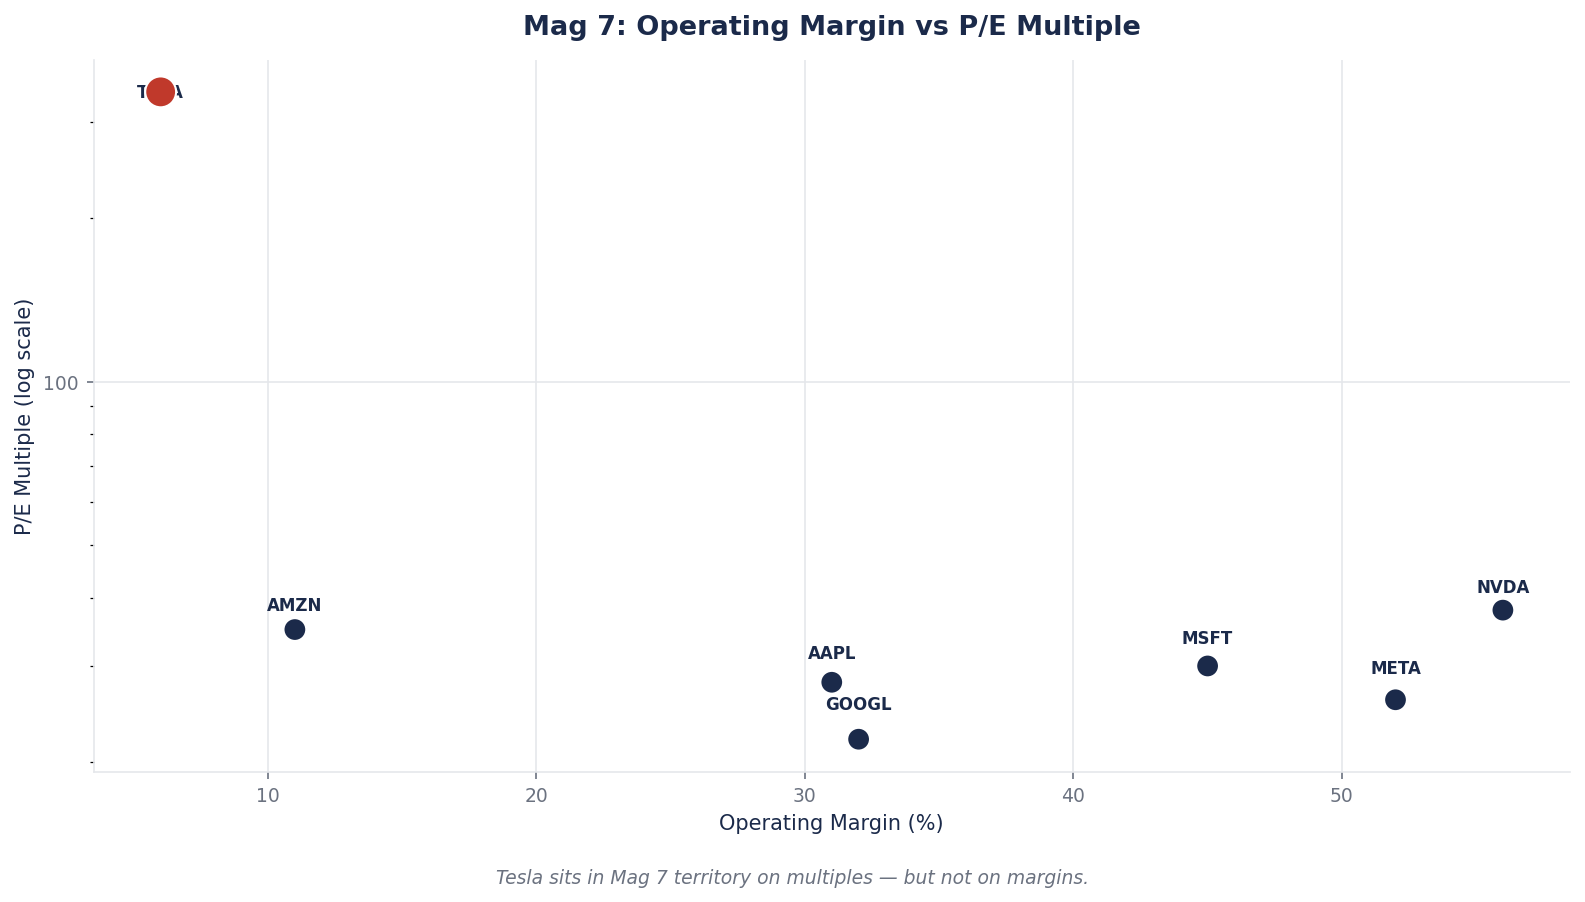
This is where the comparison gets sharpest. Tesla has Mag 7 membership in the market's mind — investors treat it as a tech franchise — but its operating margins (5.7 percent) are a fraction of the Mag 7 median (36 percent), and its P/E is 11x the group's median. Applying the Mag 7 median P/E of 30x to Tesla's trailing EPS of $1.09 produces a stock price of about $33. Applying the Mag 7 median EV/Revenue of 8.8x produces an enterprise value of roughly $835 billion, or about $220 per share.
The Comps Verdict
| Comp Lens | Implied Fair Value per Share |
|---|---|
| Auto manufacturer peers | ~$20 |
| AI platform peers (risk-adjusted) | ~$180 |
| Mag 7 franchise | $33 (on P/E) to $220 (on EV/Revenue) |
None of these is "right." But the range itself is the signal. No reasonable peer comparison produces a number close to $373.60. Every lens, even the generous ones, implies Tesla trades at a premium to its closest comparable businesses — usually a substantial one. The market is not pricing Tesla against peers. It is pricing Tesla against its own future self.
Method 3: Precedent Transactions — What Would a Buyer Pay?
The third lens asks a different question entirely. If Tesla were to be acquired tomorrow, what would a rational strategic buyer pay?
This is the weakest lens for Tesla because no precedent exists at Tesla's scale. No company has ever been acquired at Tesla's size and at Tesla's multiple. The largest automotive M&A deals in history are far smaller and far cheaper on a multiples basis.
Tesla-Adjacent M&A Benchmarks
| Target | Event | Year | Deal Size | EV/Revenue at Deal | Context |
|---|---|---|---|---|---|
| Rivian IPO | Public offering | 2021 | ~$100B valuation | ~100x | Pre-revenue growth premium |
| Lucid IPO (SPAC) | Public offering | 2021 | ~$24B valuation | High, speculative | Pre-revenue |
| Nikola IPO (SPAC) | Public offering | 2020 | $12B peak | N/A (pre-revenue) | Subsequently collapsed |
| GM acquisition of Cruise (AV) | Strategic | 2016 | $1B | N/A | Pure technology |
| Large-cap auto M&A | Various | 2015–2024 | $10–30B typical | 0.5–1.5x | Mature auto industry |
The data is clear. Strategic buyers in the auto industry pay 0.5x to 1.5x revenue. IPO buyers at growth peaks paid 100x revenue for EV startups in 2020–2021 — and nearly all of those names subsequently collapsed 80 percent or more.
There is no realistic scenario in which a strategic acquirer pays Tesla's current $1.40 trillion valuation. An acquirer at 5x revenue — already generous for any deal in history — would value Tesla's equity at roughly $475 billion, or about $127 per share. An acquirer at 10x revenue would value it at roughly $950 billion, or $253 per share.
For Tesla specifically, the precedent-transactions lens serves less as a valuation method and more as a reality check. There is effectively no realistic M&A floor that supports the current stock price. Even a Tesla trading at half today's price would still be the most expensive large-cap acquisition in history by a wide margin.
Putting It Together: Three Answers for One Tesla
Here is the full triangulation. Three methods, three ranges, and the current market price.
| Valuation Method | Low | Mid | High |
|---|---|---|---|
| DCF (operational) | $38 | $85 | $204 |
| Comparable Companies | $20 | $130 | $220 |
| Precedent Transactions | $125 | $190 | $255 |
| Current Stock Price | ~$373 | ||
| Blended Fair Value Range | $85 | $220 |
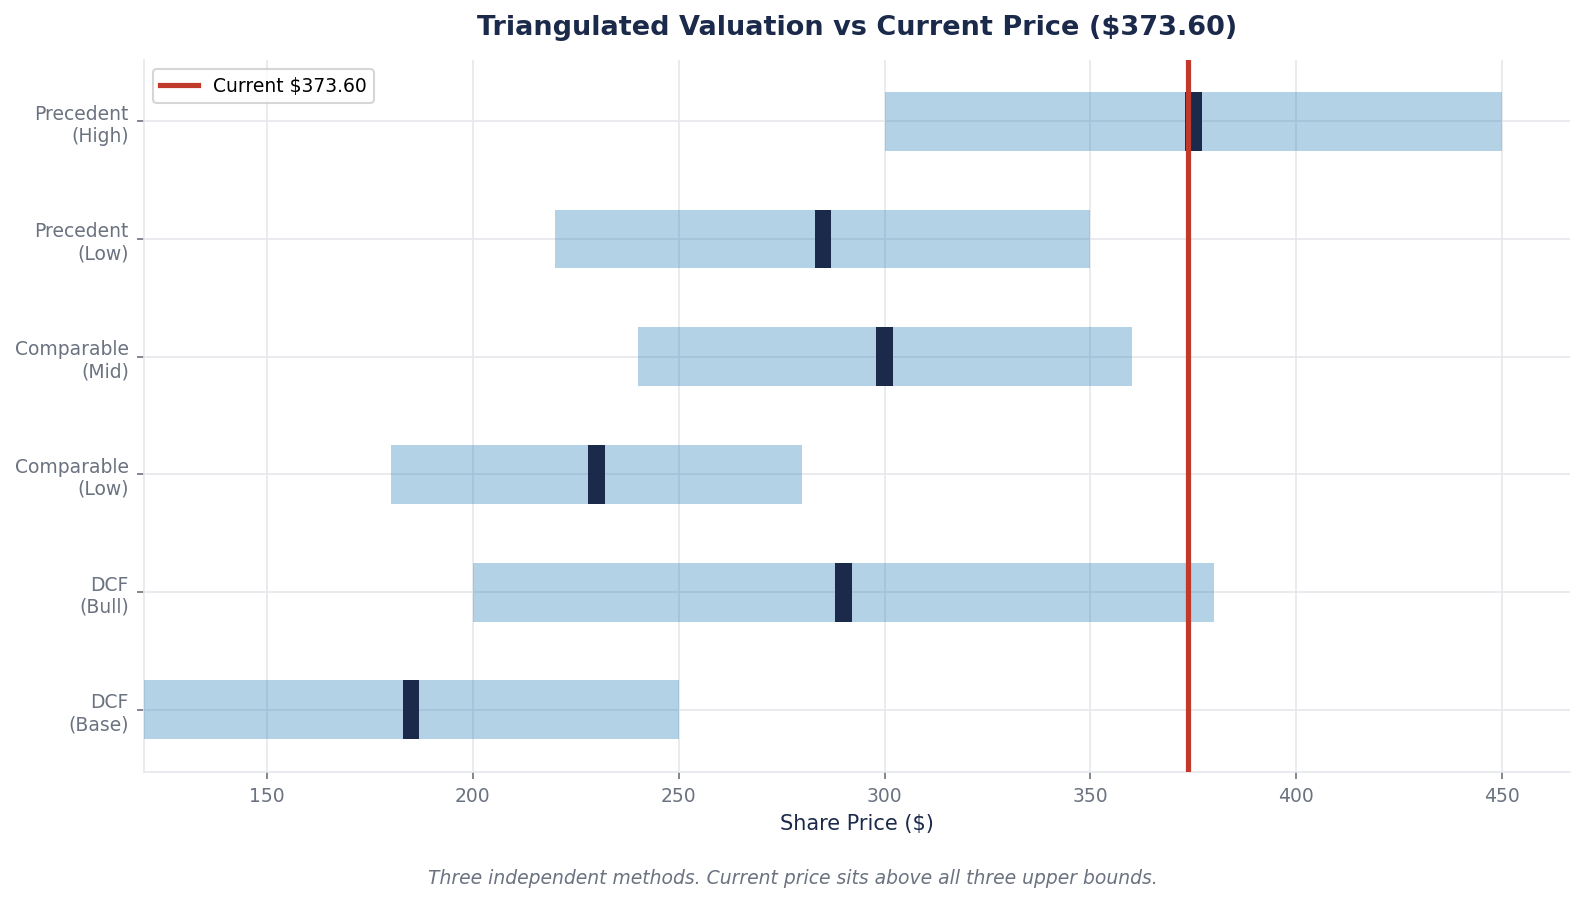
Three independent methods. None of their central ranges supports $373.60.
The most generous reading — taking the upper bound of each method — produces a fair value range of about $204 to $255. The midpoint consensus across all three sits around $150. The current price implies Tesla trades at roughly 2.5x the midpoint and 1.5x the most optimistic upper bound.
What Does This Actually Mean?
It does not mean Tesla is going to $150. Stocks trade above conventional fair value for years, sometimes decades — especially when the underlying business is undergoing a category shift the market is trying to price ahead of the fundamentals. Momentum, narrative, scarcity of high-conviction growth names, and index inclusion can sustain a premium indefinitely.
What it does mean is concrete:
1. Forward returns are structurally compressed. A stock trading at 2x–3x its blended fair value cannot produce strong returns over long horizons unless the underlying business grows into the price. For Tesla to be "fairly valued" at today's level in five years, earnings would need to grow roughly 5–7x between now and 2031.
2. The thesis is entirely about the future. You are not buying the Tesla of April 2026. You are buying a specific belief about the Tesla of 2030–2035 — a robotaxi fleet generating software-like margins, Optimus at scale, FSD monetized across tens of millions of vehicles, a dominant position in stationary energy storage. The current financials do not support the price. The future ones have to.
3. The range itself matters more than any single number. DCF says $92. Mag 7 comps say $33 to $220. Precedents say there is no realistic deal floor anywhere near today. That spread is the information.
That does not mean the narrative is wrong. It means the standard valuation tools cannot verify it independently. Investors who can underwrite Tesla's Physical AI platform thesis — with specific, measurable metrics (Robotaxi paid miles economics, Optimus unit shipments, FSD penetration rate, energy storage GWh deployed) — can rationally own the stock at this level. Investors who cannot articulate those specific measurable milestones are not investing. They are momentum-following with extra steps.
The three-method approach does not tell you what Tesla will do. It tells you what Tesla already is today: a stock trading on future assumptions far beyond what any backward-looking method can justify. Knowing that explicitly is worth more than any single price target. It tells you what kind of bet you are making — and what kind of bet you are not.
Case Study: The Gap Between Price and Fair Value
Consider what the three-method output really communicates. Three investors, same framework, three different conclusions.
Investor A runs only DCF. They conclude Tesla is deeply overvalued at $373.60 and avoid the stock. Eighteen months later Tesla is at $450. The DCF did not fail — the stock simply kept running on narrative, and Investor A stayed out of a position that was never justified on cash-flow math in the first place. No loss, but a significant opportunity cost.
Investor B runs only comps against the Mag 7. They conclude Tesla is expensive but plausible as a premium franchise. They buy. A Mag 7 correction takes Tesla down 35 percent while AAPL falls only 12 percent. Comps did not warn them: those ratios told Investor B that Tesla was expensive relative to peers, not that it was expensive relative to its own operational cash flows.
Investor C runs all three and sees the triangulation we just built. They conclude two things at once: Tesla cannot be valued as a cash-flow business at $373.60, and Tesla cannot be valued against any realistic peer set at $373.60. Investor C does not necessarily avoid or sell. They size the position small. They recognize they are making a narrative bet on a specific future, and they size for the volatility that accompanies that kind of bet. When Tesla moves 40 percent in either direction, Investor C is not surprised — they priced the possibility into their position size at the start.
The three-method approach does not tell you what Tesla will do. It tells you what kind of bet you are taking, and how to size it accordingly.
The Common Mistake: Treating the Three Methods as a Vote
The most frequent mistake intermediate investors make is to average the three outputs and treat the average as "the answer."
If DCF says $92, comps say $130, and precedents say $190, the average is $137. Buy at $100, sell at $170. The math looks clean. The thinking is broken.
The three methods are not meant to vote. They are meant to argue. When DCF and comps disagree, that gap tells you the market sees something DCF does not. When comps and precedents disagree, that tells you what strategic value looks like versus passive public-market value. When all three disagree — as they do for Tesla — that tells you the stock is trading on a mechanism none of them can price.
The honest output of a three-method valuation is not a price target. It is a written statement about what kind of bet the current price represents. For Tesla today: "I am paying a premium to every conventional valuation method because I believe in a specific non-conventional future." That sentence, written out, is the discipline. It forces you to defend the specific belief rather than hide behind an average.
What to Watch
Three habits turn multi-method valuation from a ranking exercise into a real thinking tool.
Watch the gap between the three methods. When DCF, comps, and precedents cluster tightly (within 20 percent of each other), you have a high-confidence valuation. When they spread wide — as they do for Tesla, where the range runs from $20 to $255 depending on lens — that spread itself is the information. Something unusual is priced into the stock, and you need to understand exactly what before you act.
Watch how the methods agree or disagree over time. A year from now, rerun the three. If DCF rises because Tesla's operating margin has expanded to 12 percent, and comps rise because Mag 7 multiples have re-rated higher, and precedents are unchanged — the gap is closing because fundamentals are catching up to price. If only the stock price has moved and the three methods are unchanged, the gap is widening because narrative is running ahead of everything else.
Watch whether the narrative variables are becoming measurable. For Tesla, the narrative rests on Robotaxi paid miles, Optimus unit shipments, FSD penetration, energy storage GWh deployed. Each of these is becoming measurable as the company reports them. The day those numbers start printing at scale is the day narrative becomes measurable, and DCF starts to work again as a primary tool rather than a floor check.
Brutal Edge Coverage Integration
This week's framework maps directly onto our coverage:
- TSLA Deep Dive Rev.2 (BEAF 58/C+) — the full triangulation with updated assumptions from Q1 2026. Our scoring reflects a thesis that is viable but not compelling at the current price. The DCF, comp, and narrative sections in that report apply the exact method built here.
- Physical AI Sector Report — the narrative variables (Robotaxi, Optimus, FSD) that drive Tesla's gap between fair value and market price are dissected in sector-level detail, including competitive positioning against Waymo, Chinese AV programs, and humanoid robotics peers.
- NVDA Deep Dive (BEAF 83/B+) — the cleaner case where DCF and comps actually converge on a high-margin compounder rather than diverging wildly. Useful as a contrast to Tesla's wide-range valuation.
- Anthropic Private Investor Report — reference for how pre-revenue AI franchises are priced when traditional methods cannot yet apply.
For additional frameworks, see our Deep Dive archive. Every name we cover is run through this three-method test before scoring.
Looking Ahead
Next week we dismantle DCF further. Not to abandon it — DCF remains one of the most important thinking tools any investor can own — but to examine specifically why small changes in assumptions produce such wide ranges, and what to do about that. We rebuild the model with NVIDIA, where the cash-flow numbers are cleaner and the narrative less speculative, and watch exactly where and why even that cleaner DCF starts misleading even professionals.
For now, sit with this week's lesson. Tesla's stock price and Tesla's fair value are two different things that travel together over long periods and separate dramatically over short ones. Three methods will never give you one answer. They will give you a range and a set of assumptions — and the discipline to defend the assumptions is the edge.
Brutal Edge. Frameworks over forecasts. Signal over noise.
Disclaimer. Brutal Edge is an independent investment research platform. This report is published for educational and informational purposes only and does not constitute investment advice, a recommendation to buy or sell any security, or an offer to transact in any financial instrument. All valuations, forecasts, and opinions are the analyst's own and are subject to change without notice. Past performance does not guarantee future results. Readers should conduct their own due diligence and consult a qualified financial professional before making investment decisions.
Educational content only. Not investment advice. Always do your own research.