INVESTING 101 INTERMEDIATE12 LESSONS · 4 PHASES · W13–W24
You Know the Basics.
Now Build the Edge.
Twelve weeks of institutional-grade analysis applied to real companies. Valuation that goes beyond P/E. Moat analysis that goes beyond buzzwords. Document forensics, earnings call interpretation, and portfolio management frameworks that professional investors actually use.
~190 min total reading
Real companies: TSLA, NVDA, MSFT, AAPL, Intel, Anthropic
37 original charts — all generated from real data
→
Prerequisite: Investing 101 Beginner
This series assumes you can read a basic income statement and understand what P/E means. New to investing? Start with the Beginner series →
1
PHASE 1
Valuation
W1317 min
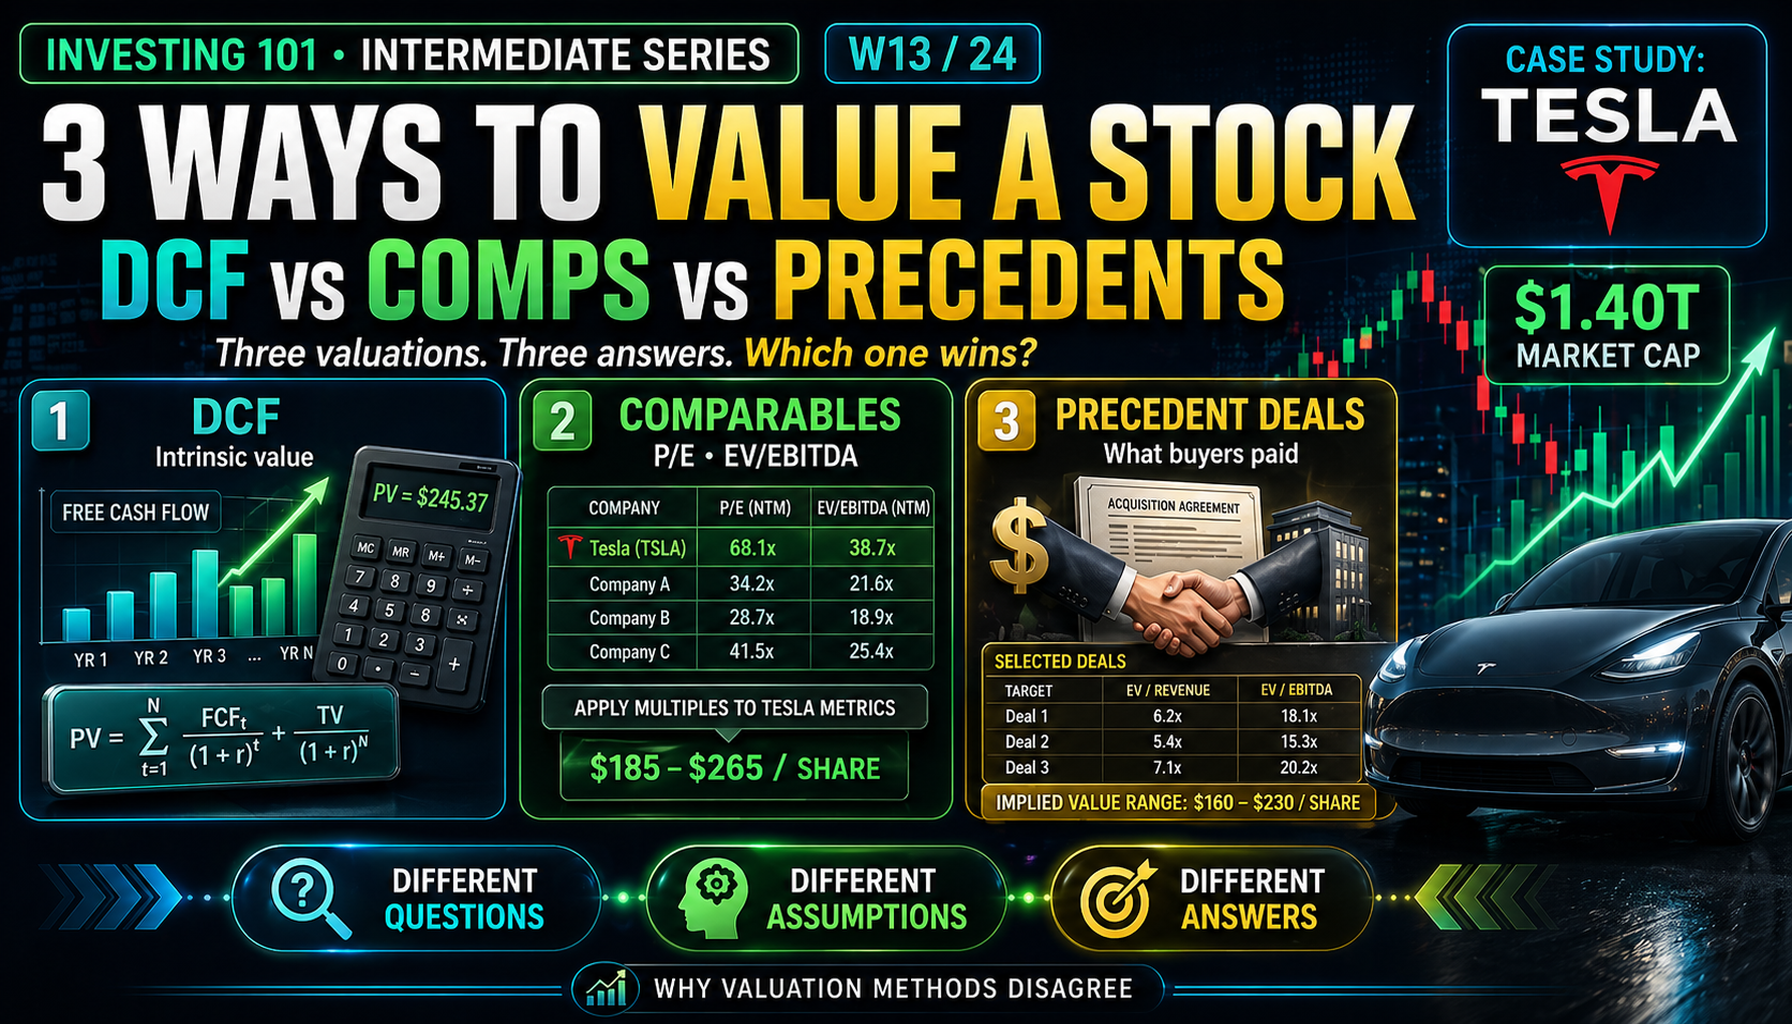
Three Valuations. Three Answers. Which One Wins?
Tesla through DCF, comparables, and precedent transactions — three methods, three answers, and what the disagreement tells you.
W1416 min
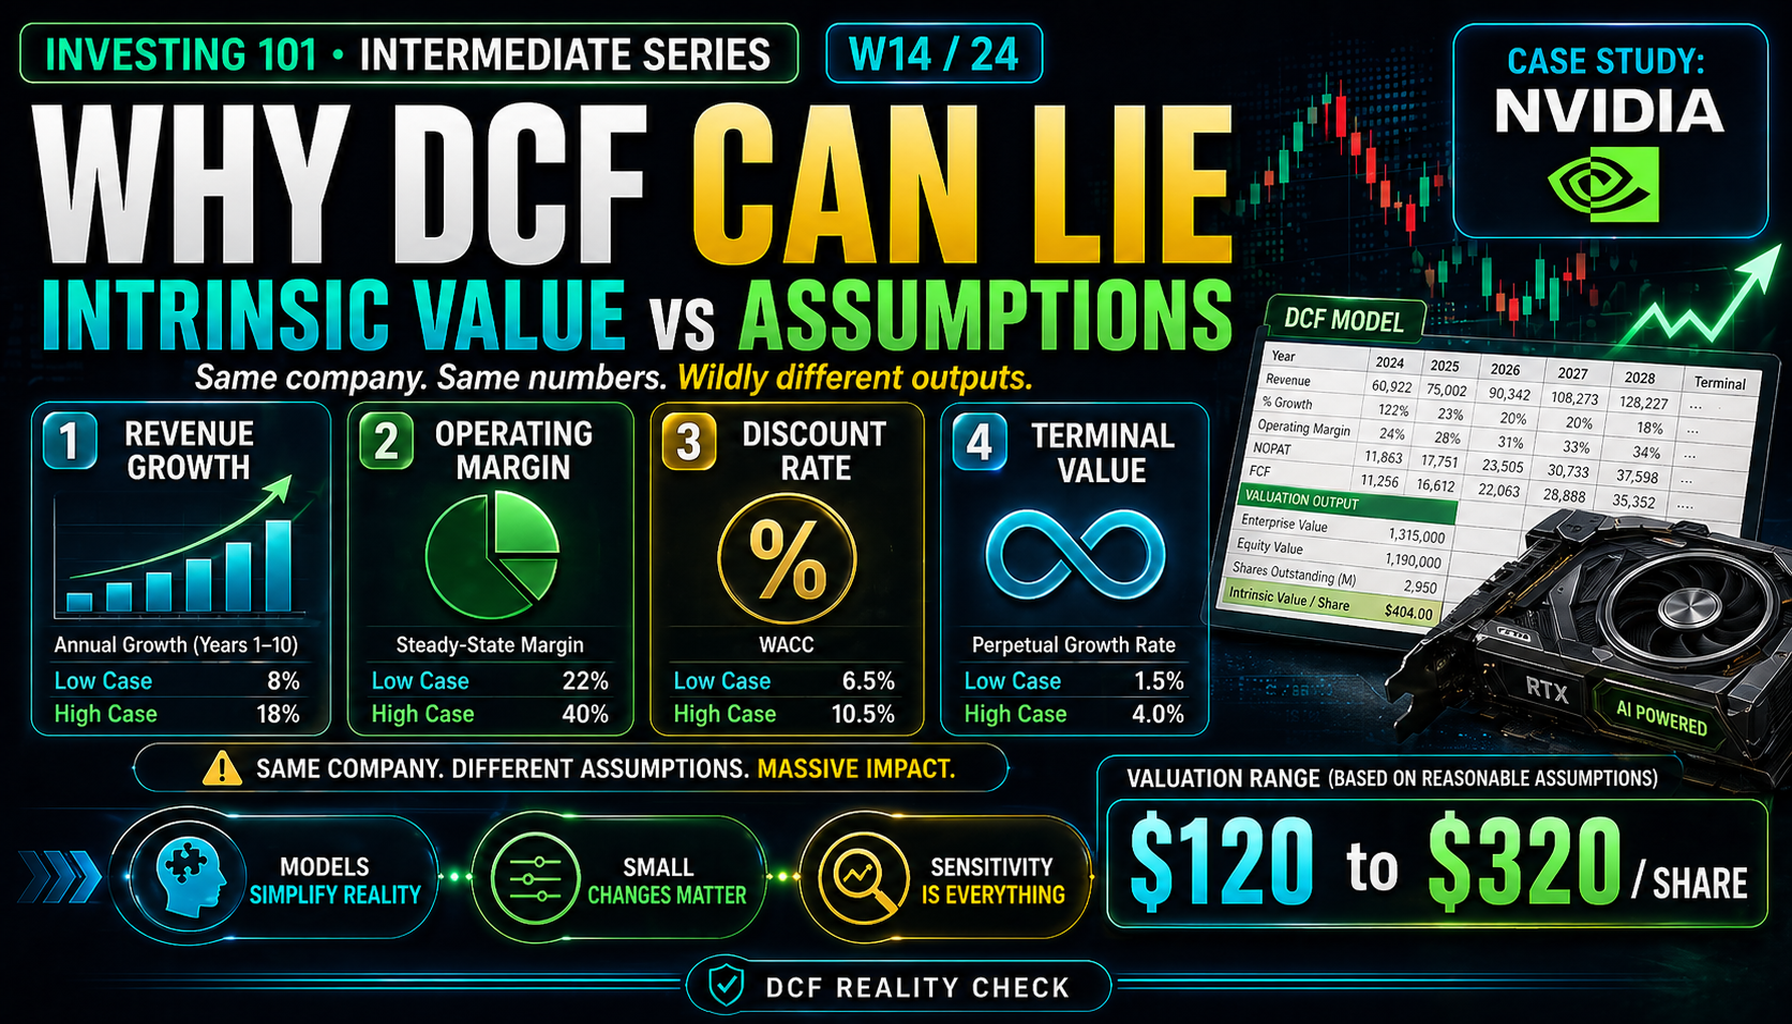
DCF: The Spreadsheet That Lies to You
NVIDIA's DCF says it's overvalued. The stock has compounded 30% per year for five years. This week we find out why — and what to do instead.
W1515 min
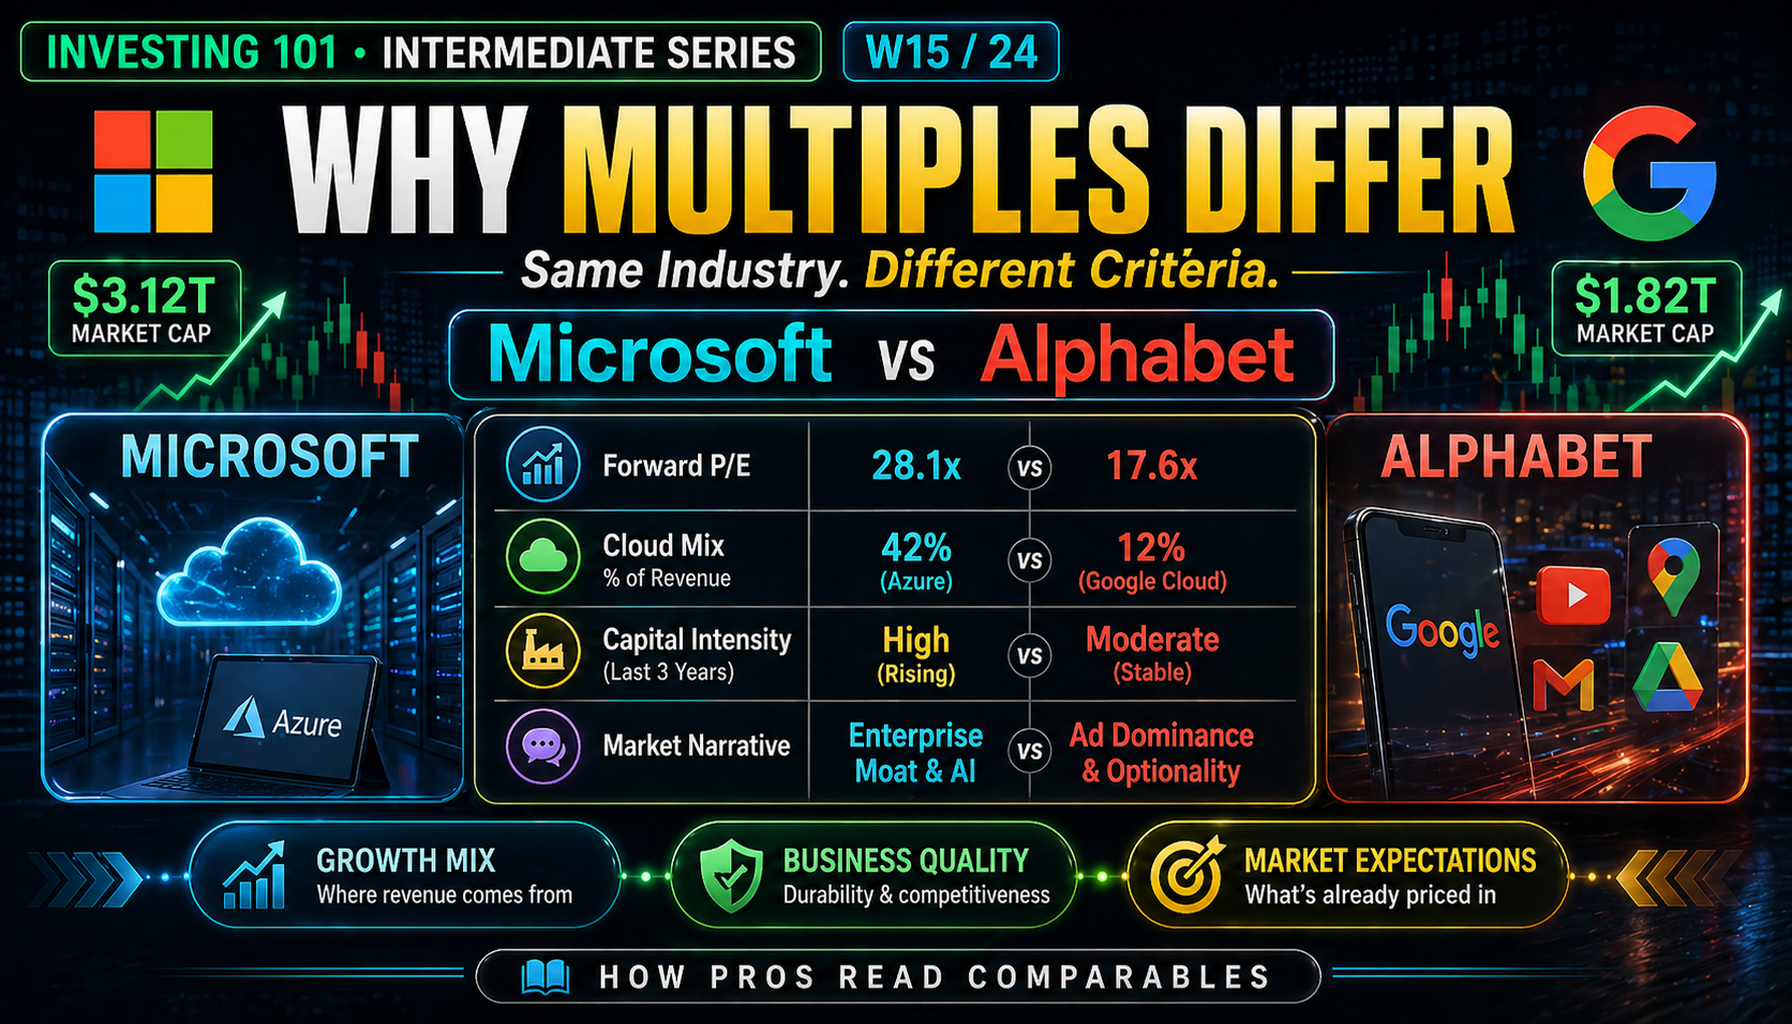
Same Industry. Different Multiples. Why?
Microsoft and Alphabet both trade at ~30x. The three layers that explain why identical P/Es reflect completely different businesses.
2
PHASE 2
Moat Analysis
W1616 min
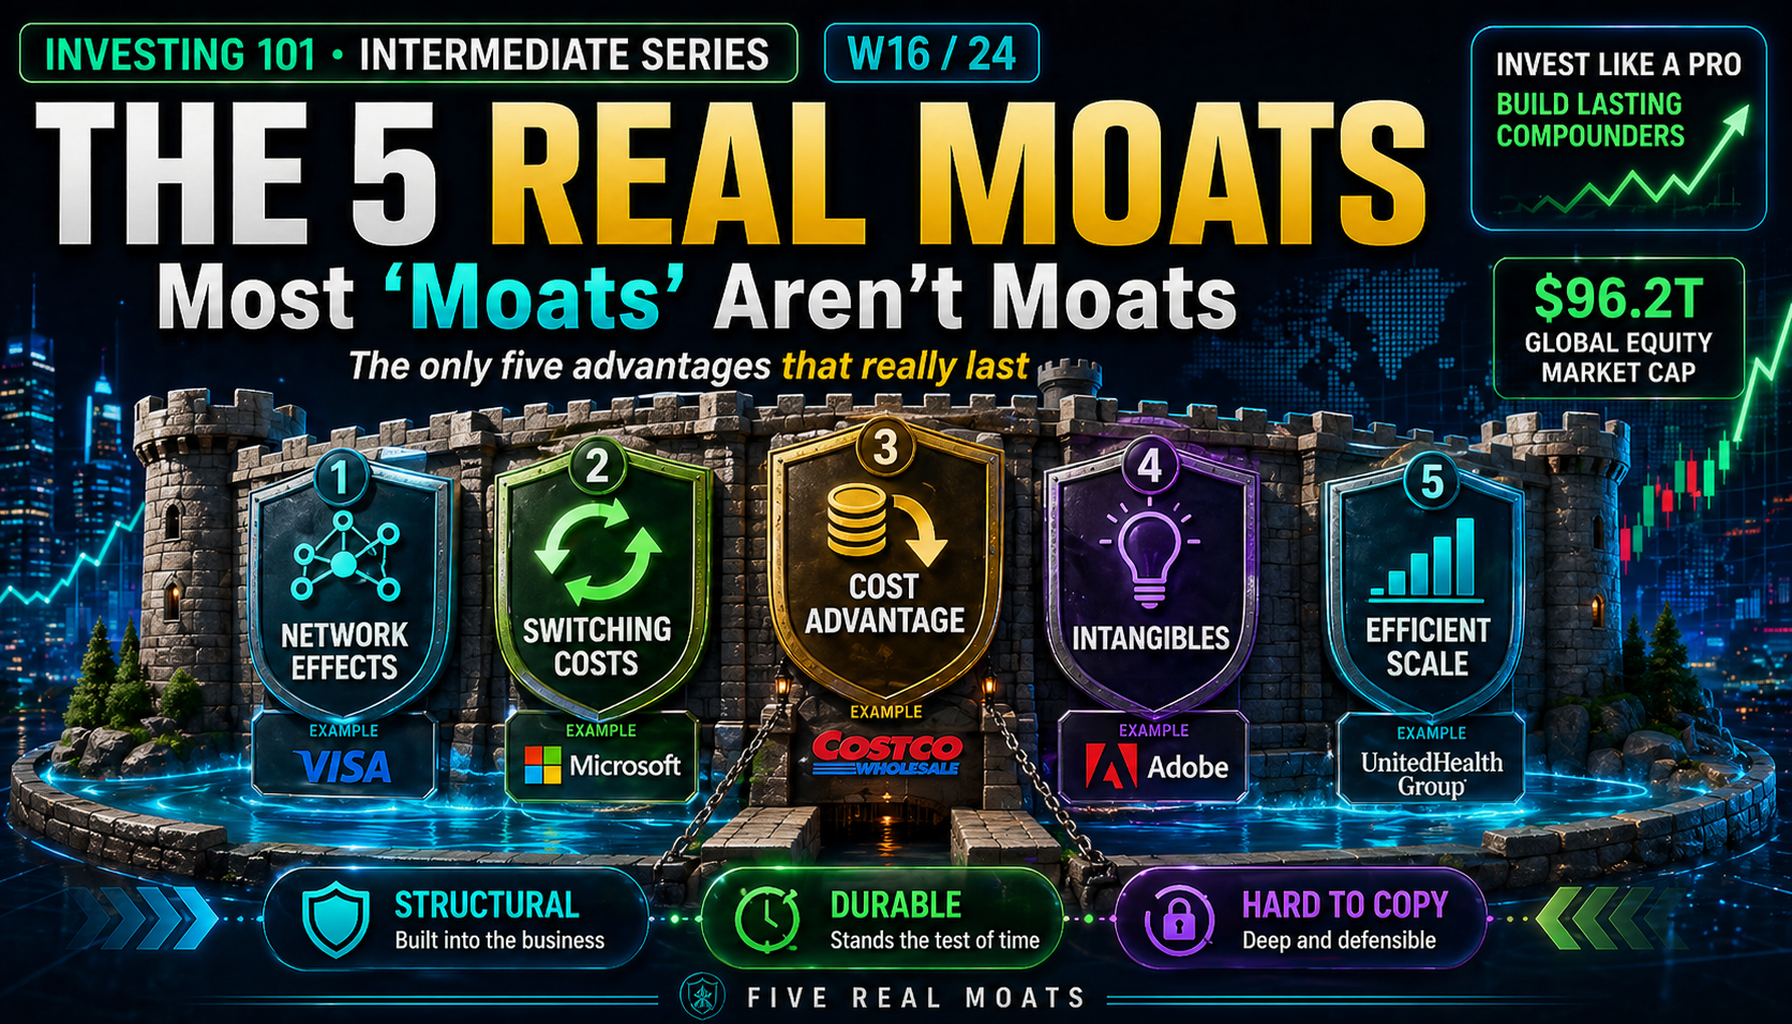
Most 'Moats' Aren't Moats. Here Are the Five That Are.
Five structural moats that show up in a decade of compounding ROIC — applied to five real businesses you probably know.
W1715 min
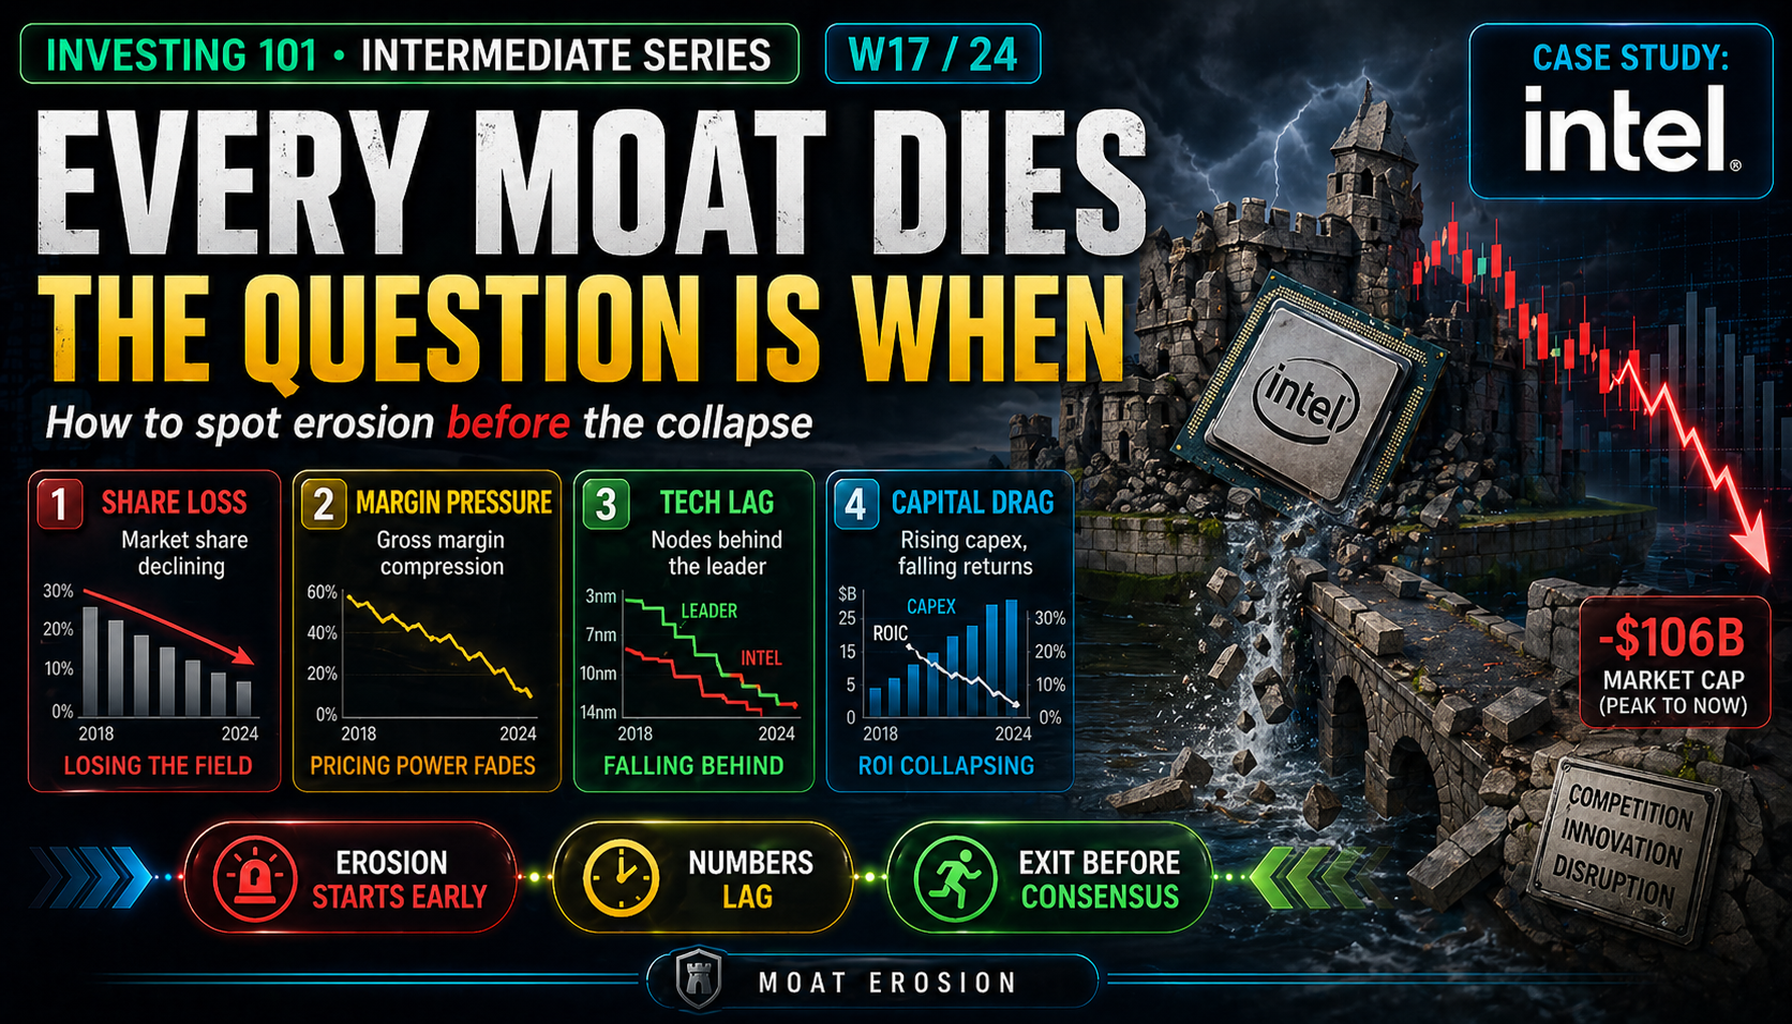
Every Moat Dies. The Question Is When.
Intel went from 25%+ ROIC to negative in 20 years. The six-stage erosion sequence — and how to spot it years before it shows in earnings.
W1815 min
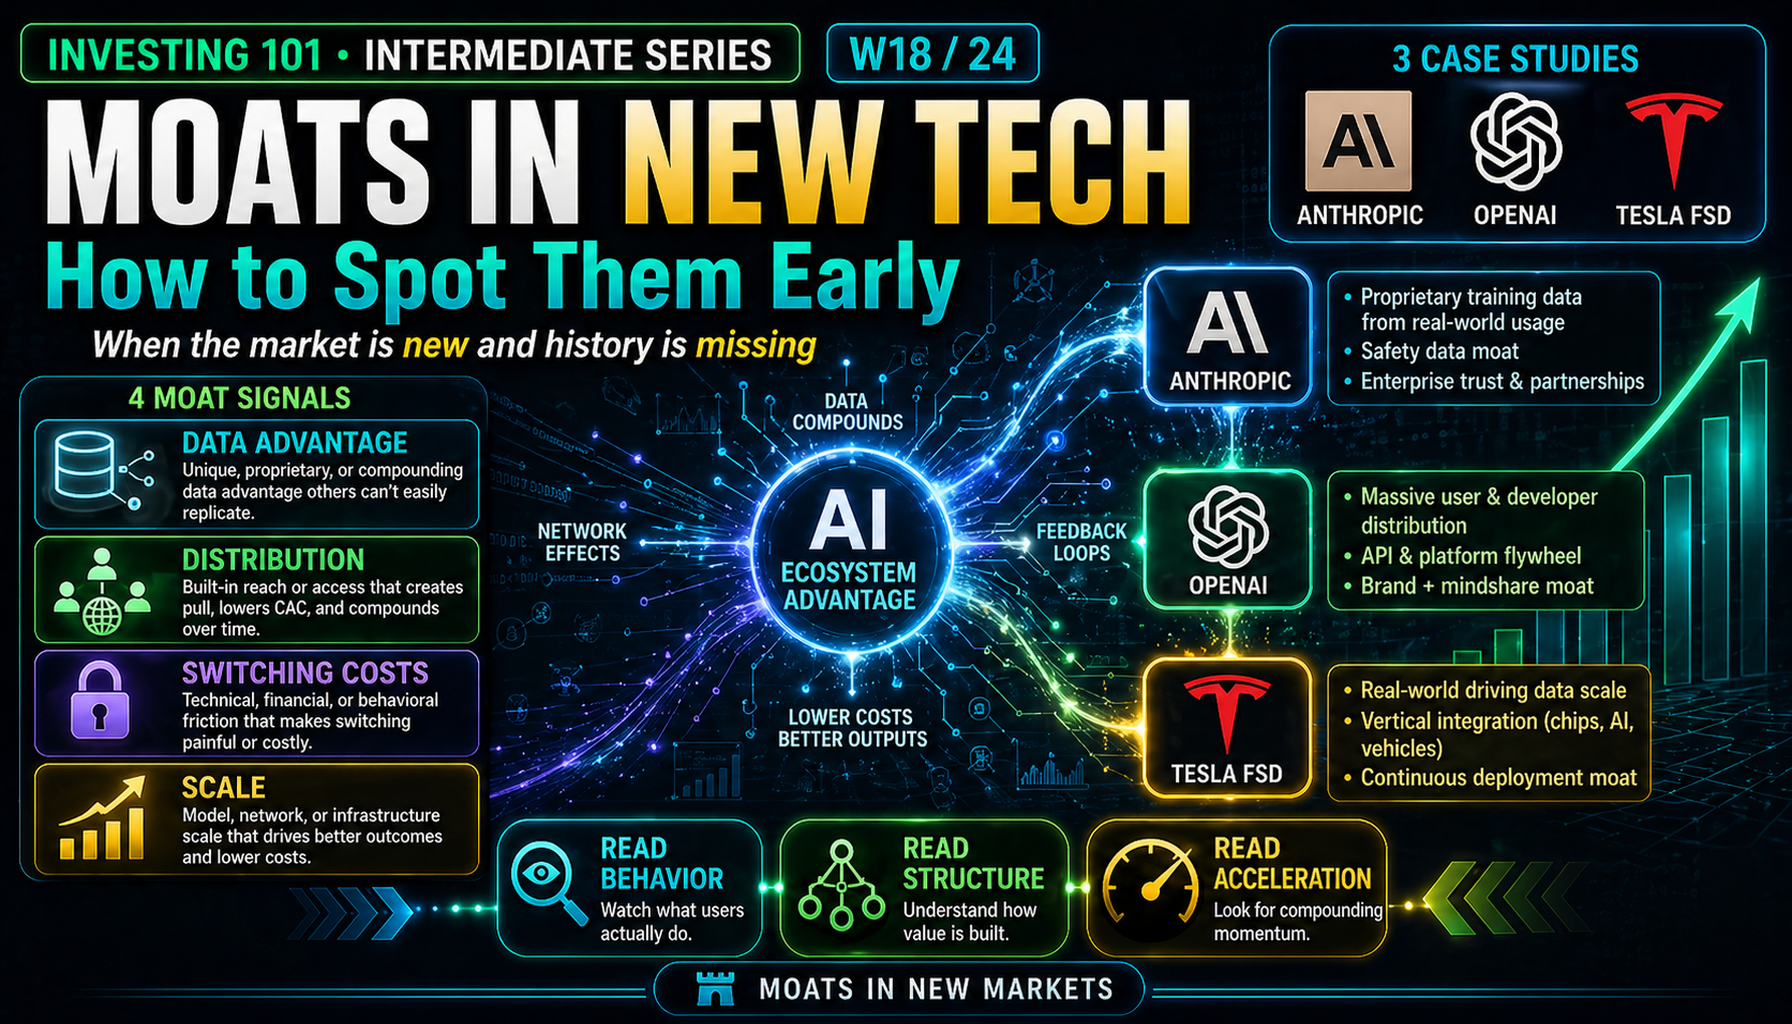
Moats in Markets That Didn't Exist 5 Years Ago
Anthropic's ARR went from $1B to $30B in 18 months. The rebuilt moat framework for AI-native companies — from scratch.
3
PHASE 3
Document Forensics
W1917 min
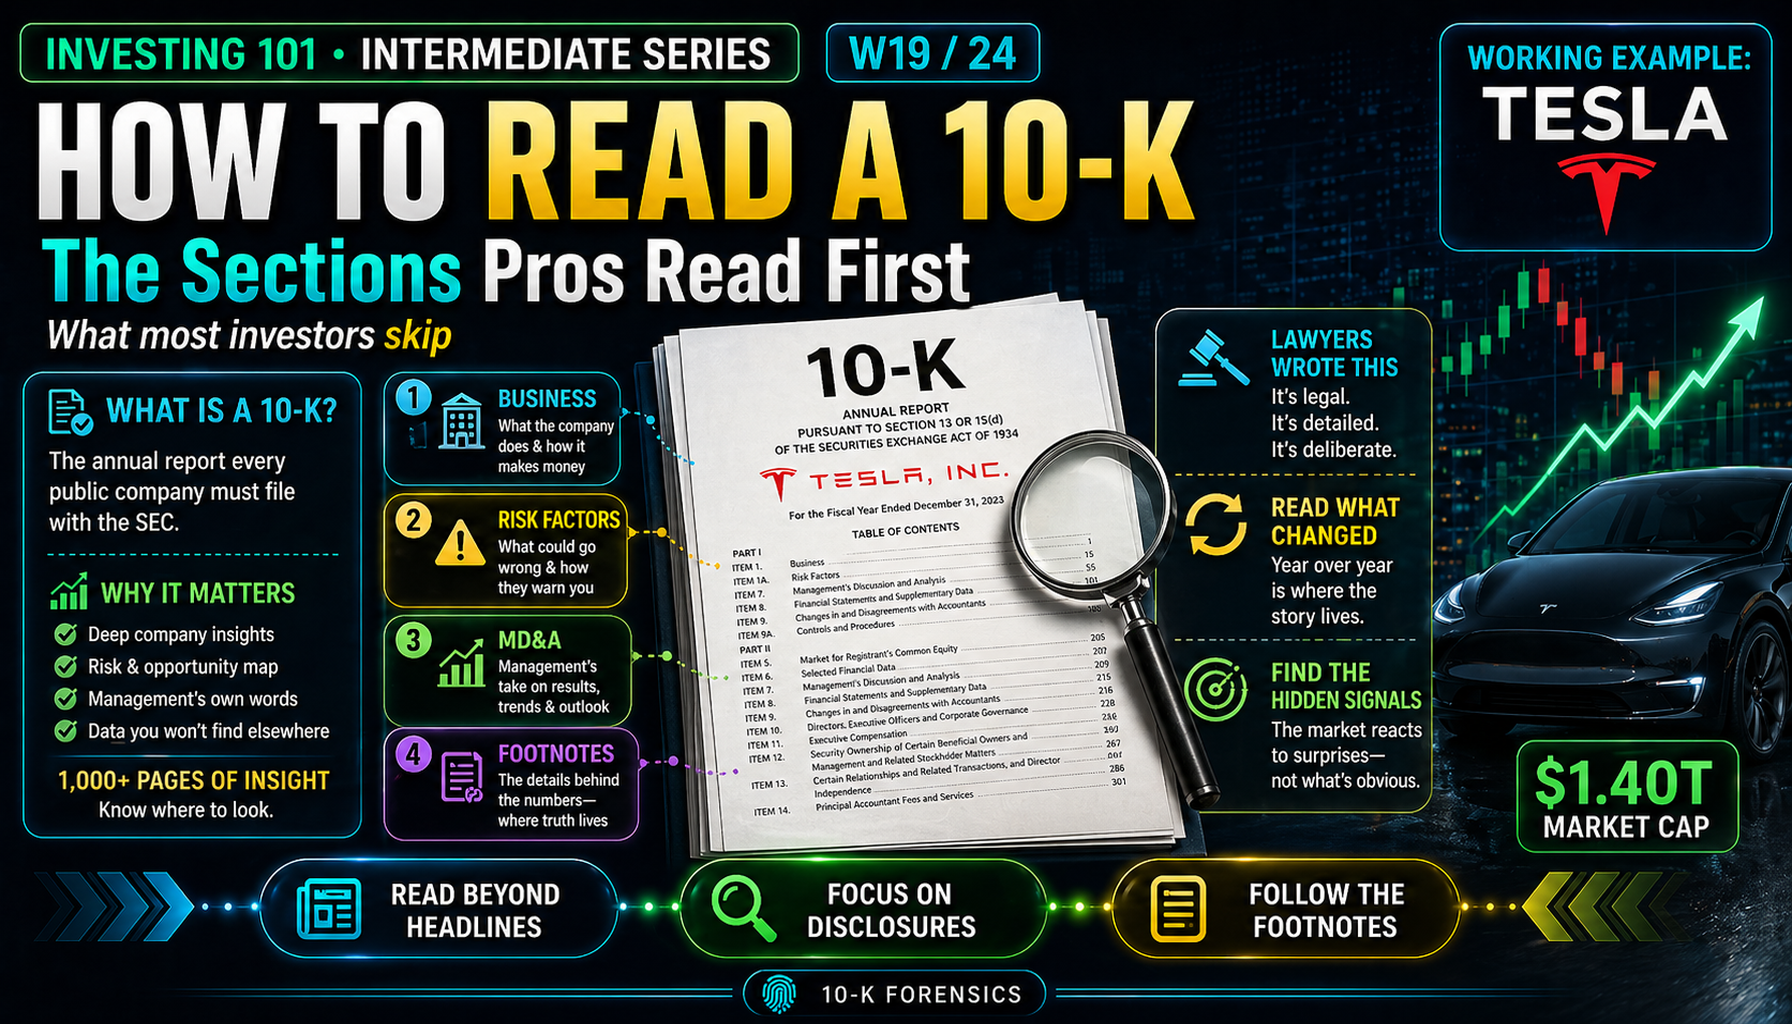
The 10-K Sections Most Investors Skip. Pros Read Them First.
Working through Tesla's actual 10-K — risk factors, MD&A footnotes, and the sections that contain the real signals.
W2016 min
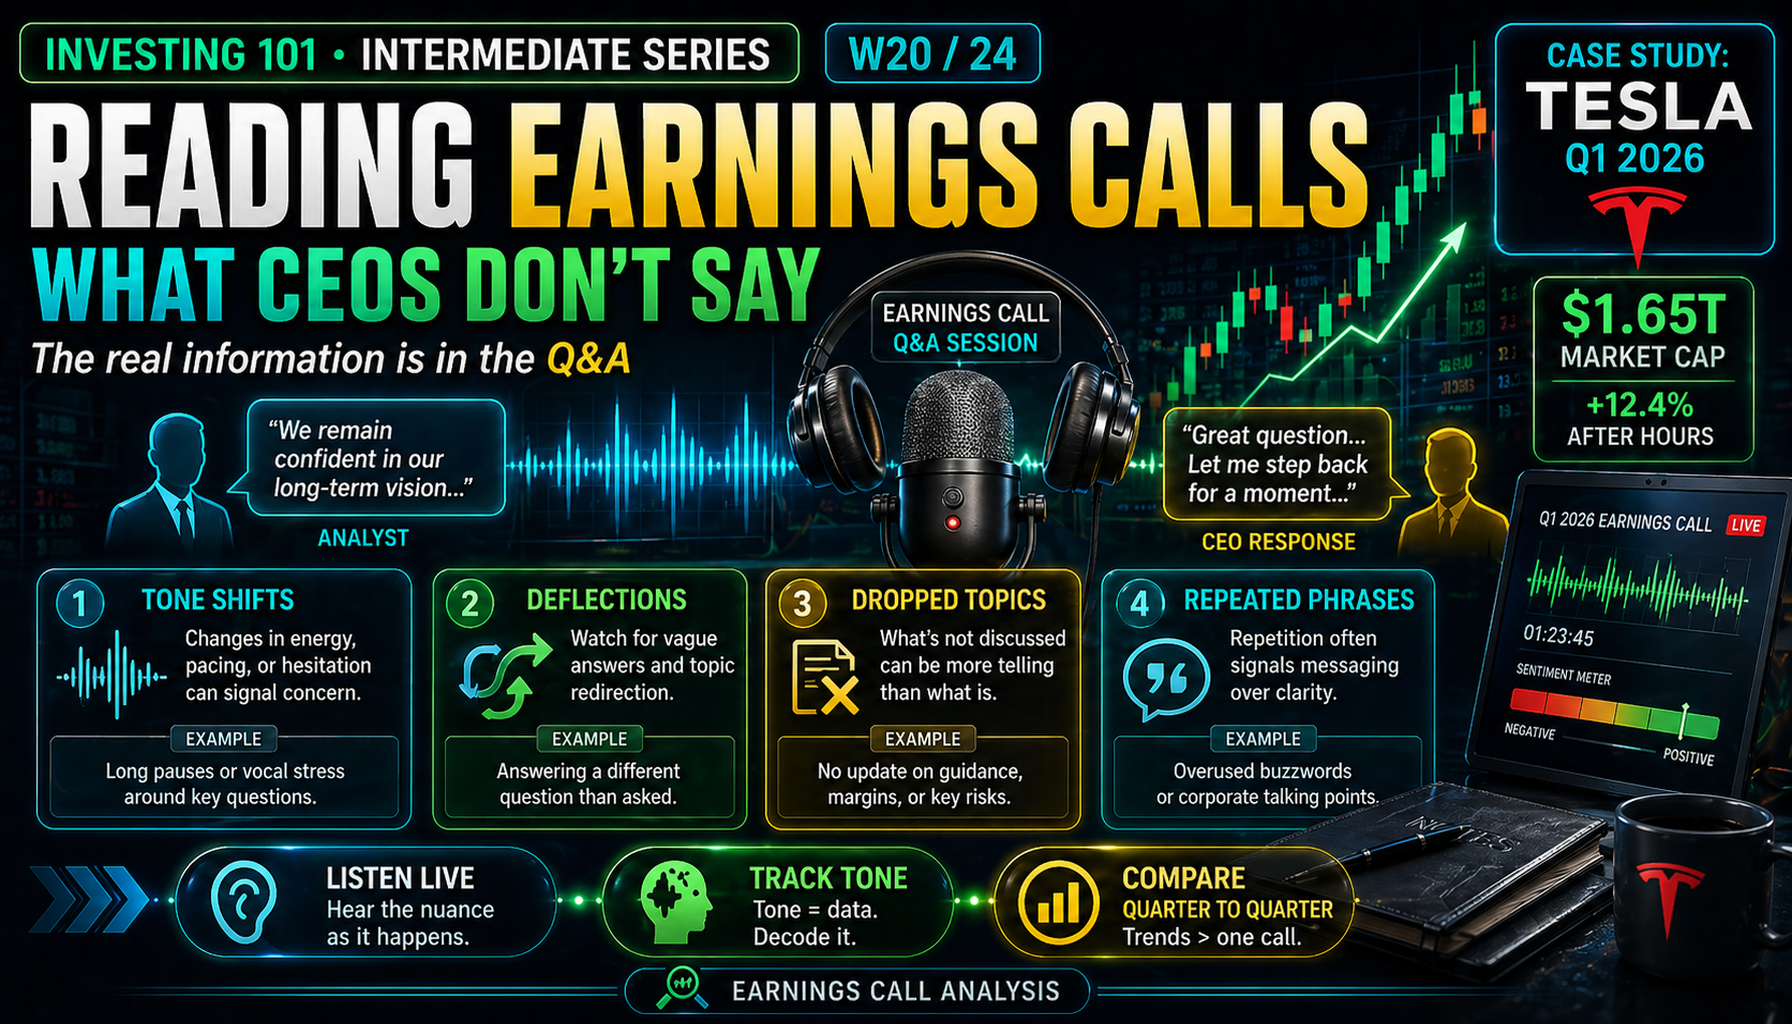
What CEOs Don't Say on Earnings Calls Tells You More
Tesla Q1 2026 earnings call — professional framework for reading what management deflects, avoids, and stops mentioning.
W2116 min
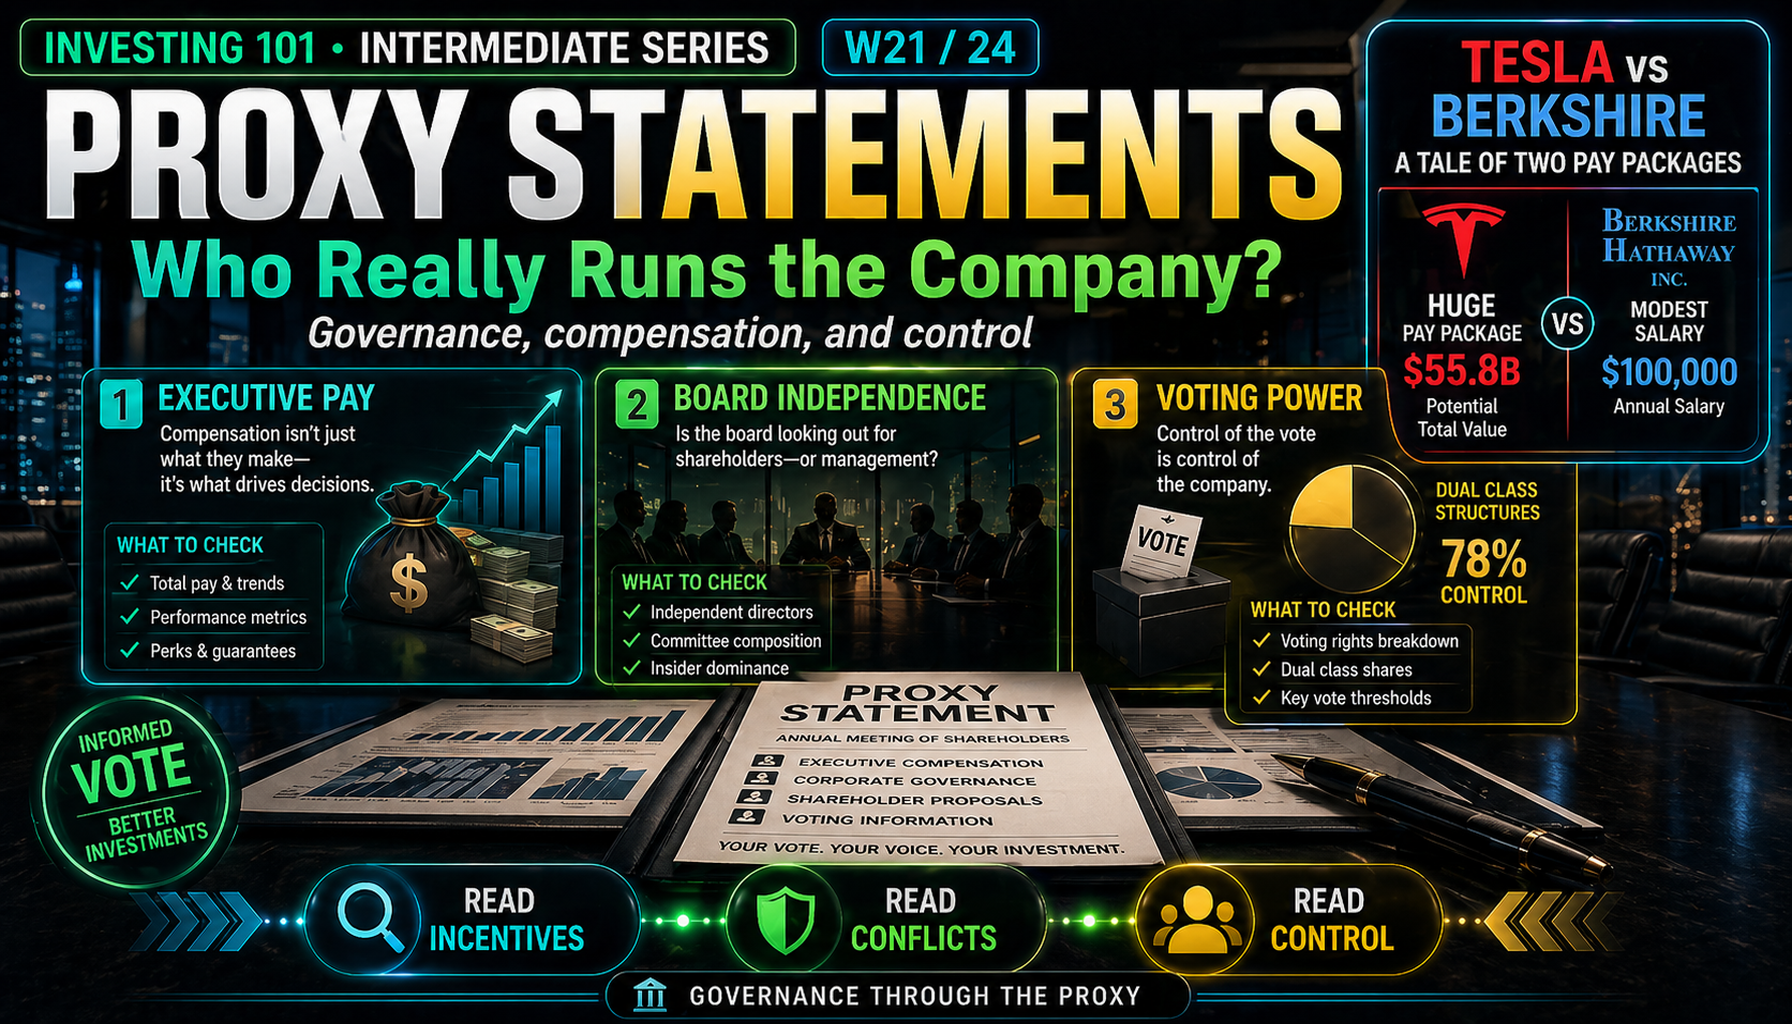
The Document That Reveals Who Really Runs the Company
Musk vs. Buffett as a governance case study. What the proxy statement actually reveals — and why most investors never read it.
4
PHASE 4
Portfolio Management
W2217 min
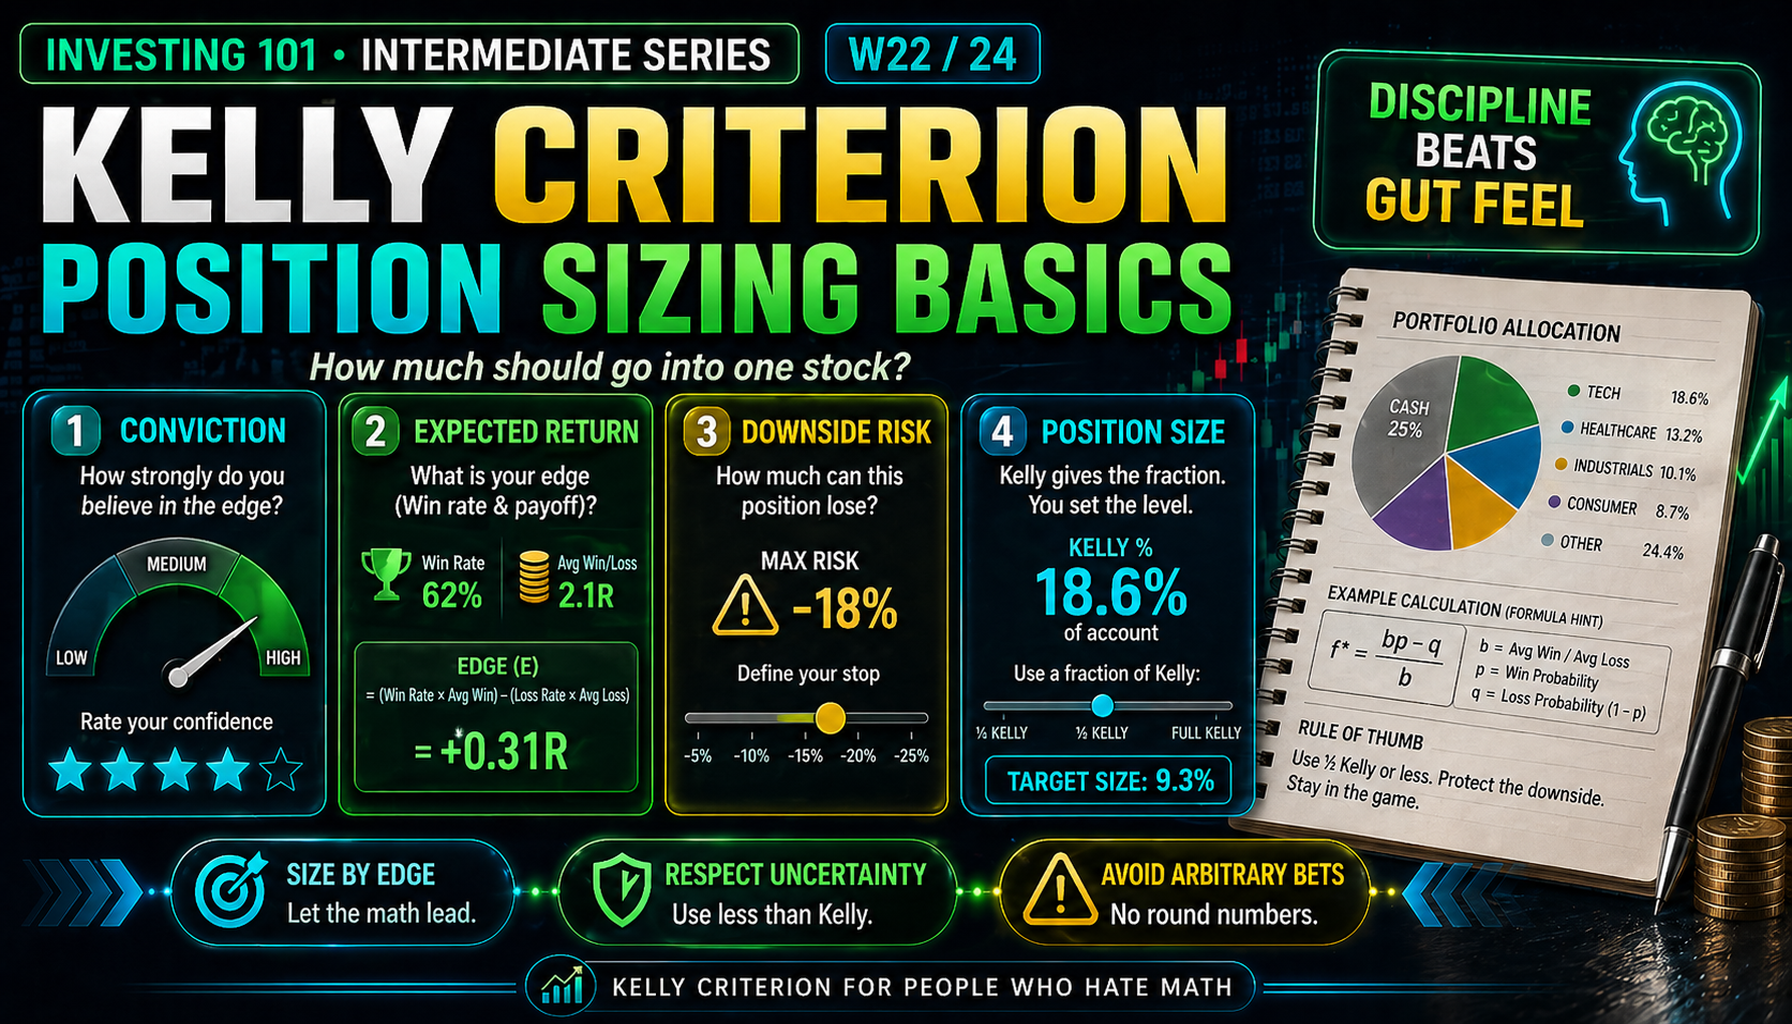
Kelly Criterion for People Who Hate Math
The framework professional gamblers and fund managers both use — applied to NVDA, TSLA, and MSFT with real numbers.
W2315 min
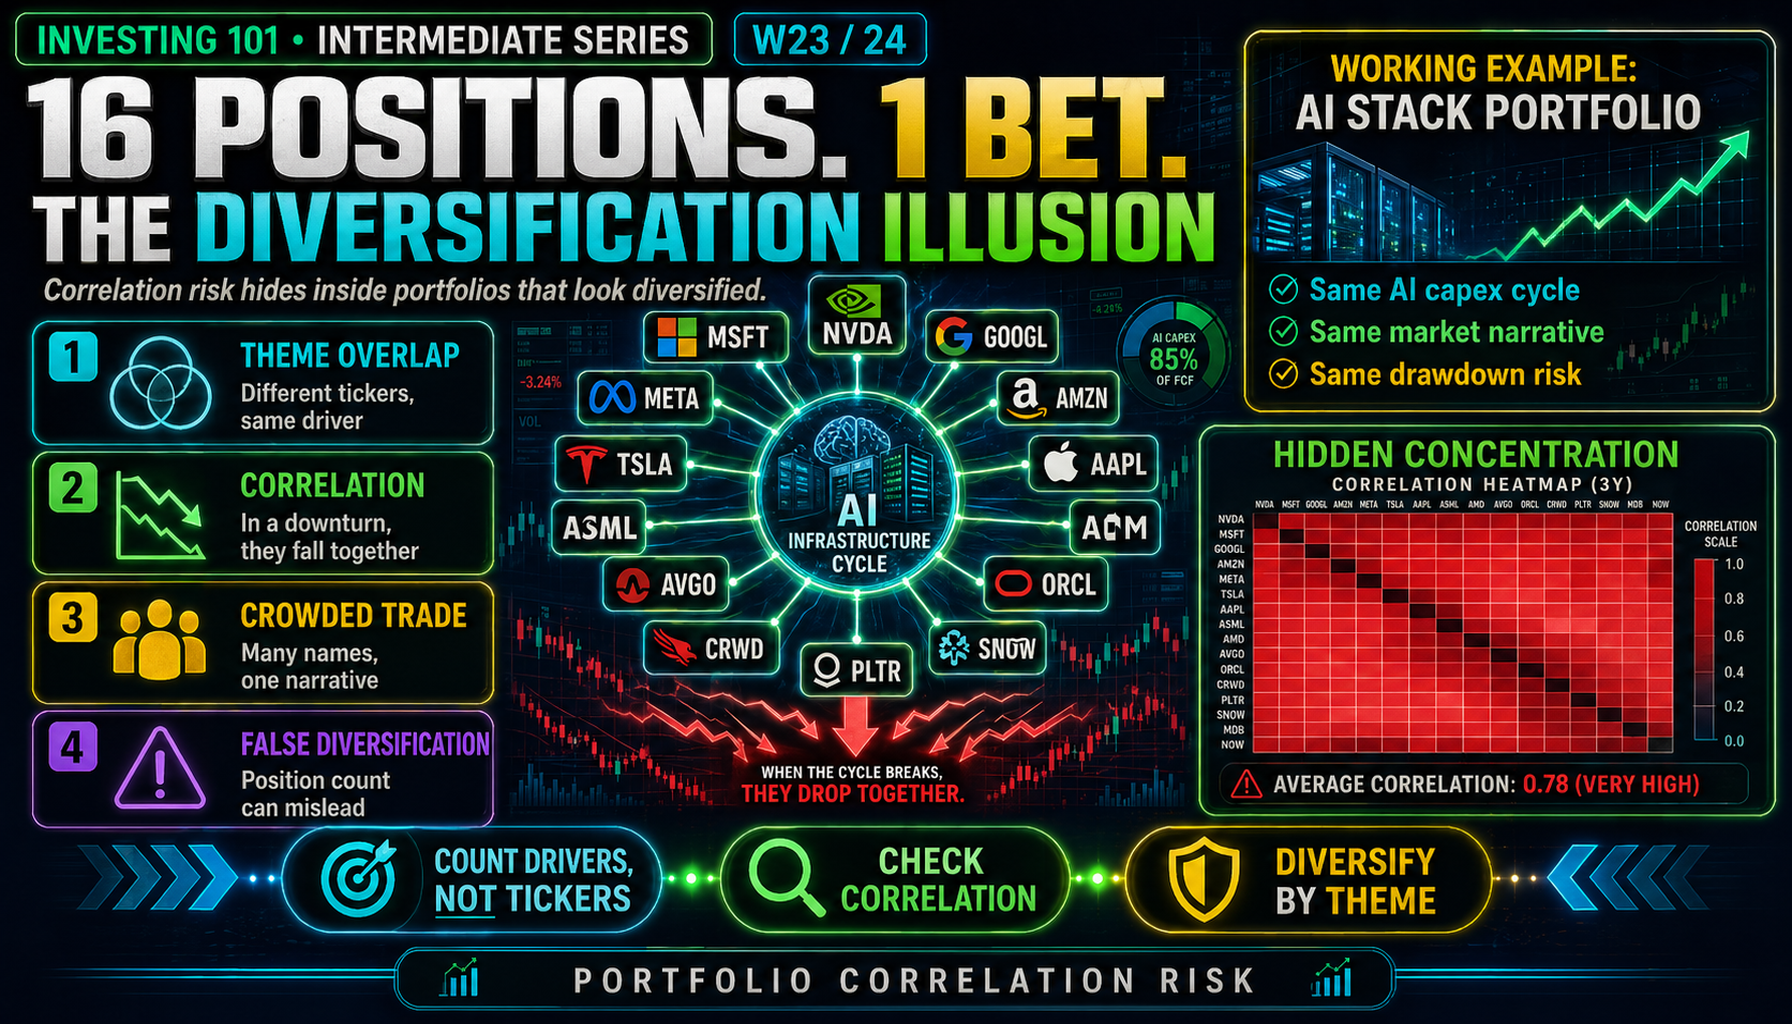
16 Positions. 1 Bet. The Diversification Illusion.
Holding NVDA, MSFT, GOOGL, META, AMZN, TSLA, AAPL — and 9 more AI names — is one position. Why the diversification is not what you think.
W2416 min
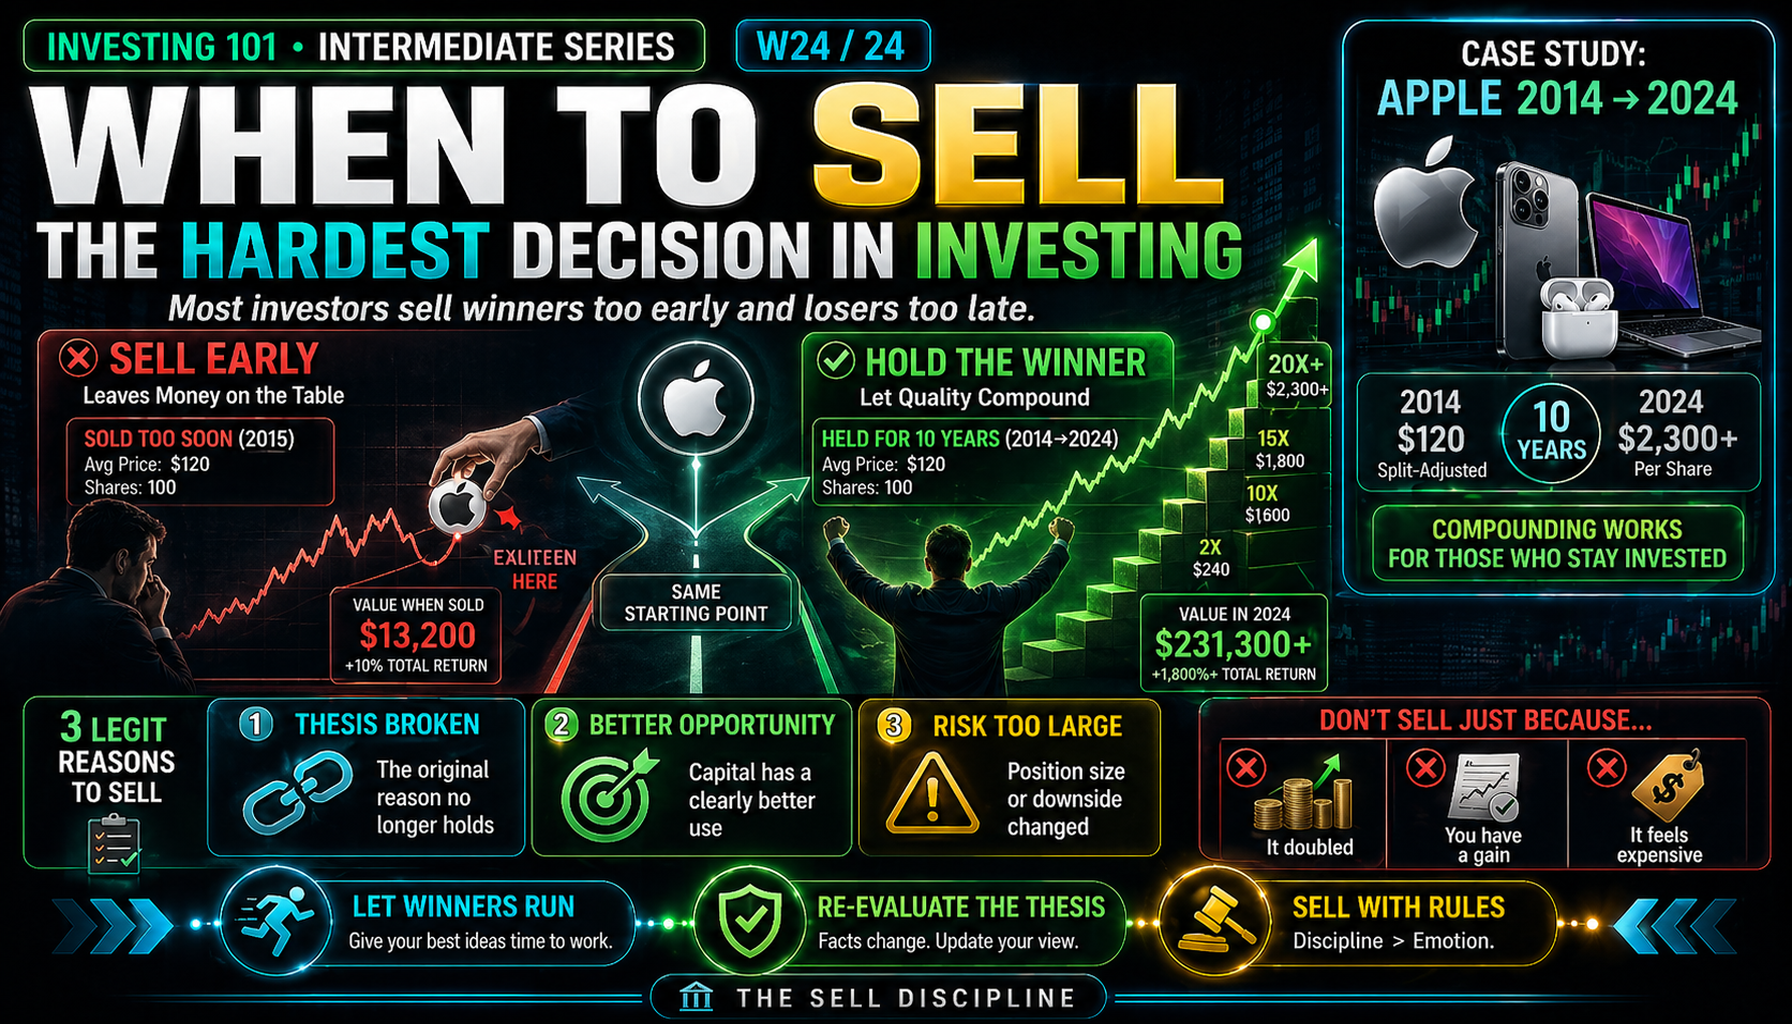
When to Sell. The Hardest Decision in Investing.
Apple 2014–2024: two investors, one stock, one sold. A three-part framework for the only three reasons that justify selling.
HOW THIS SERIES WORKS
Real Companies
Every lesson uses actual earnings data, real 10-K filings, and live market numbers — not textbook examples.
Applied Frameworks
Each framework is demonstrated, not just explained. You see it work on a real stock before applying it yourself.
37 Original Charts
Every chart is generated from real data using the same methodology professional analysts use.
Educational content only. Not investment advice. Always do your own research.