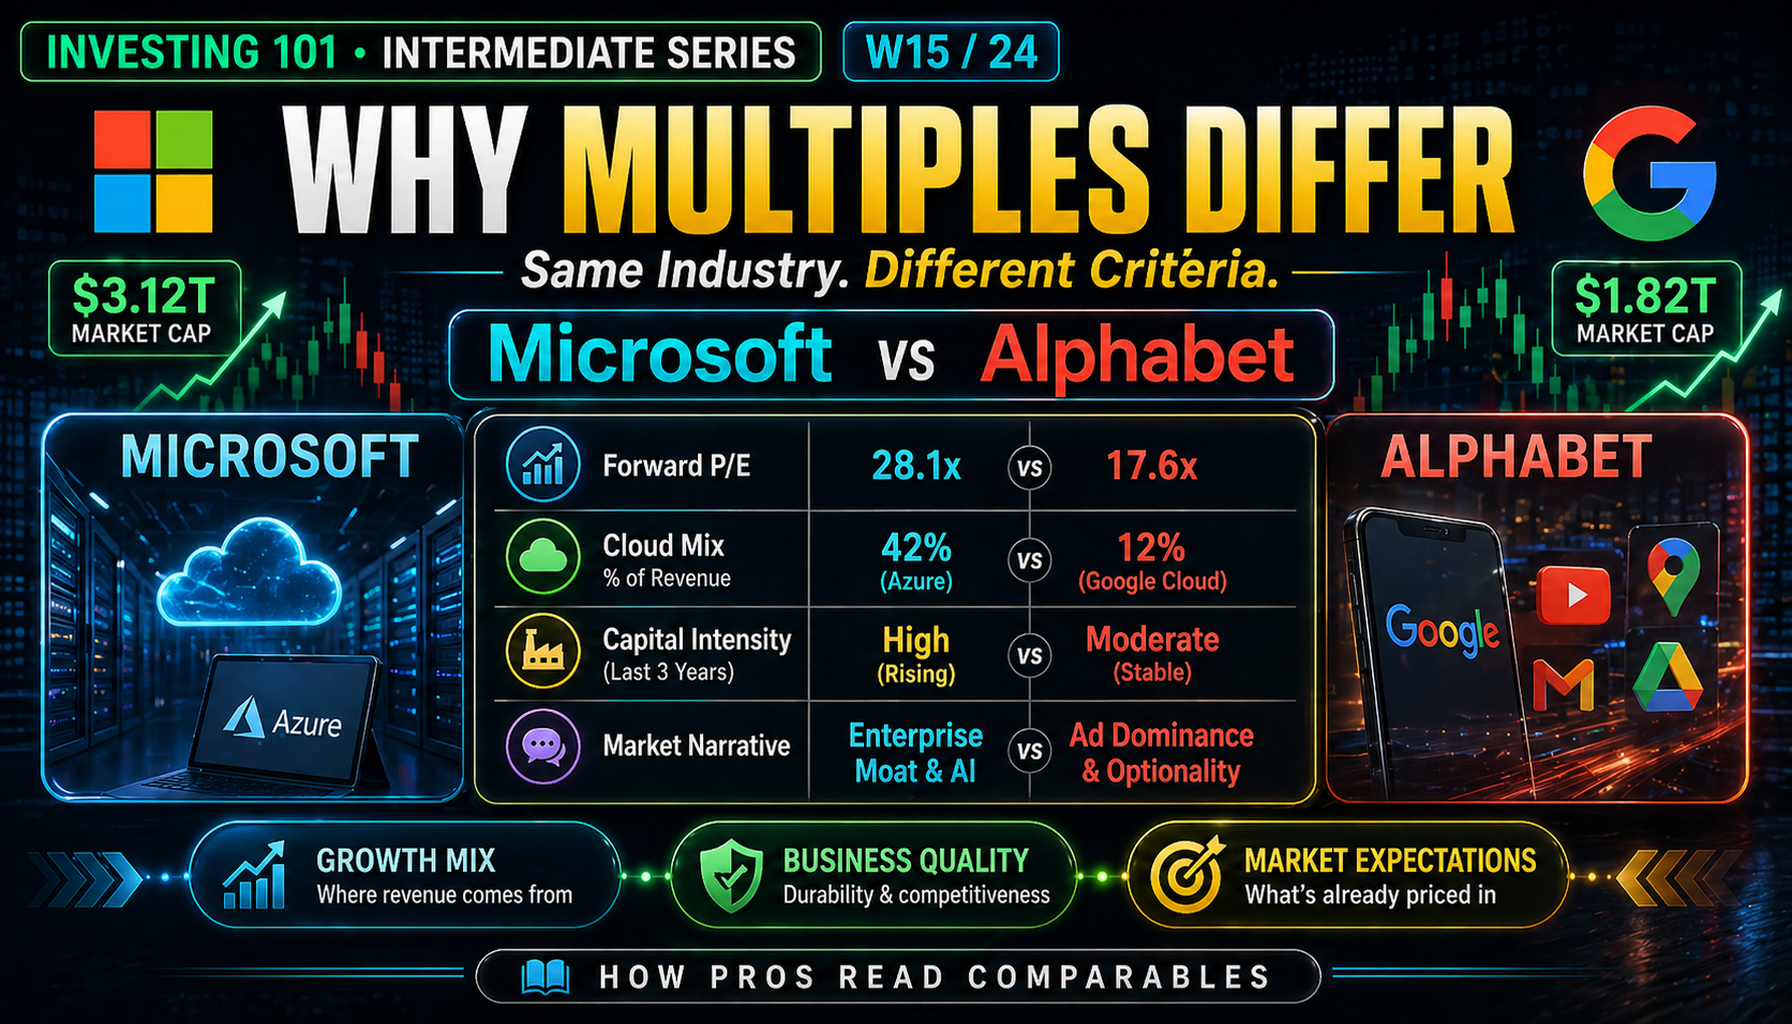
Same Industry. Different Multiples. Why?
Microsoft trades at a forward P/E of roughly 30x. Alphabet trades at 31x. Both are Mag 7 hyperscalers with dominant market positions. This week we unpack the three layers of logic that separate identical-looking multiples.
Comparables Limits
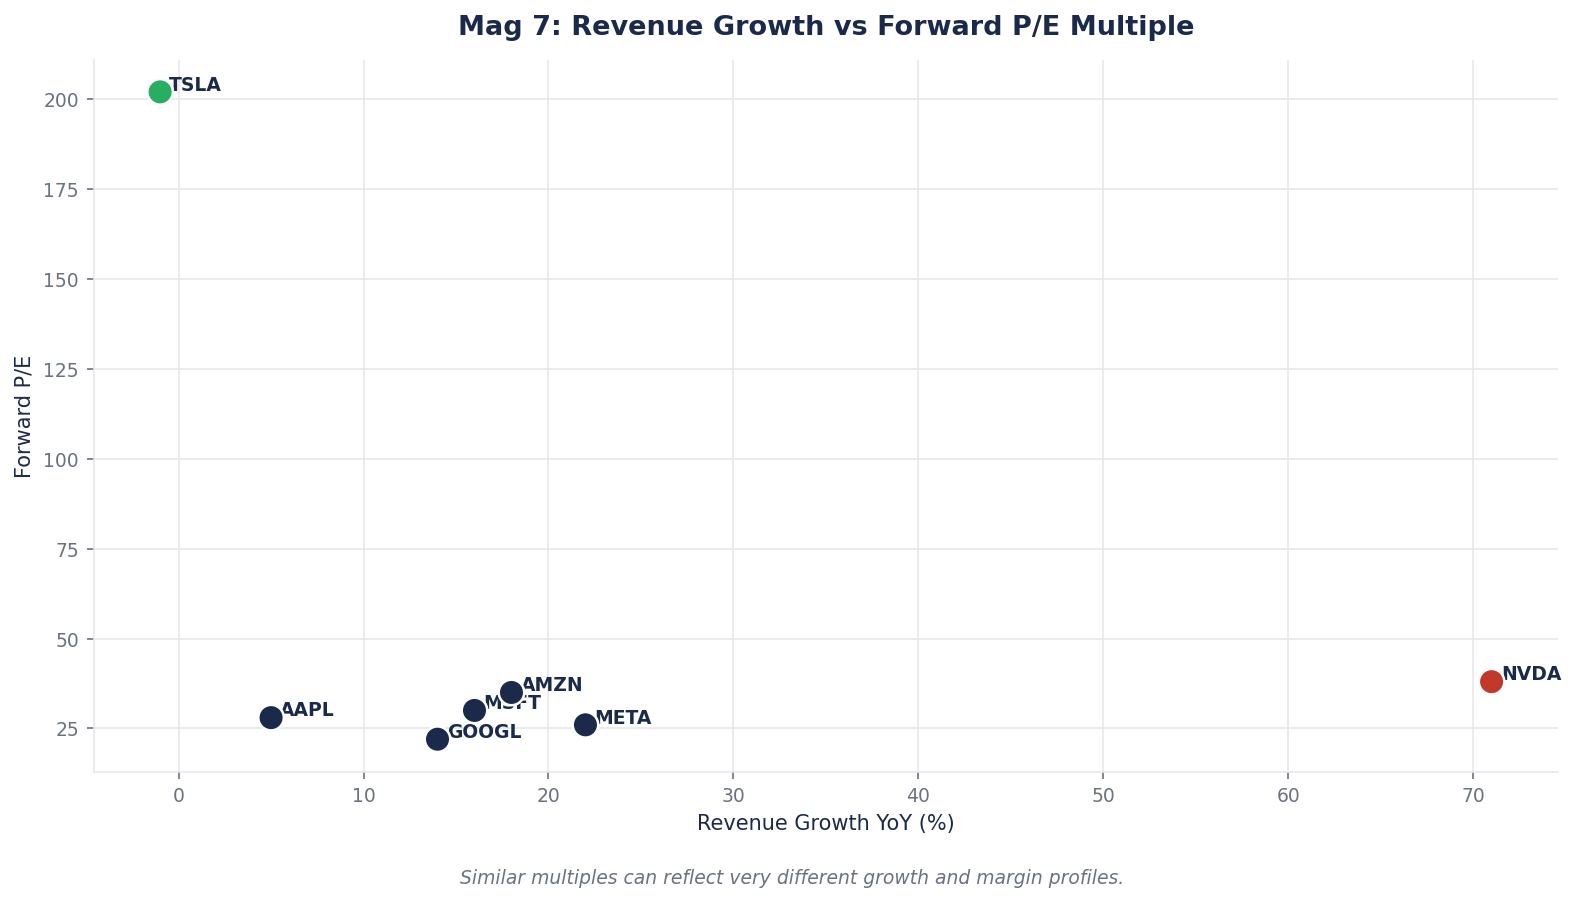
Pull up the 10 largest US tech companies. Line up their P/E ratios. You will find something strange.
Microsoft trades at roughly 32x trailing earnings. Alphabet at 31x. On the surface, two essentially identical multiples. Apple trades at 30x. Meta at 25x. Amazon at 38x. NVIDIA at 41x. Tesla at 341x. Eleven zeros of market capitalization separate the companies at the top and bottom of that list, and yet their earnings multiples span a range wider than any single analyst can defend with a single-factor explanation.
The comfortable interpretation is that the market is inefficient and someone is mispriced. That interpretation is almost always wrong. The uncomfortable truth is that the market sees something real in every one of those gaps — a structural difference that justifies the spread — and your job as an intermediate investor is to figure out what that something is.
This week we take two companies that look nearly identical on a summary screen — Microsoft and Alphabet — and decompose the gap between them. By the end you will know how to read a multiples table the way a professional reads one: not as a ranking, but as a diagnostic that reveals what the market believes about each business.
Core Framework: The Four Drivers of Multiple Spread
Two comparable companies almost never trade at identical multiples, and the gap is almost never one-dimensional. But the spread is usually dominated by some combination of four specific drivers.
| Driver | What It Measures | How the Market Reads It |
|---|---|---|
| Growth | Expected revenue and earnings growth | Higher growth = higher multiple |
| Quality | Margins, return on capital, cash conversion | Higher quality = higher multiple |
| Risk / Durability | Customer concentration, cyclicality, regulatory exposure | Lower risk = higher multiple |
| Capital intensity | CapEx required per dollar of revenue | Lower intensity = higher multiple |
Every multiple spread in the real world can be decomposed into some combination of these four. Sometimes one driver dominates. More often, two or three stack on top of each other to produce what looks like a dramatic gap.
The mistake is to see a cheap multiple and assume it is an opportunity. The discipline is to see the cheap multiple and ask — which of the four drivers is the market penalizing, and is the market right?
The Case: Microsoft vs Alphabet
Both companies just reported. Microsoft's fiscal Q2 2026 (quarter ended December 31, 2025) was announced January 28. Alphabet's fiscal Q4 2025 (same calendar quarter) was announced February 4. The reports were one week apart. The results looked, at first glance, remarkably similar.
Recent-quarter headline metrics
| Metric | Microsoft Q2 FY26 | Alphabet Q4 2025 |
|---|---|---|
| Revenue | $81.3B | $113.8B |
| YoY growth | +17% | +18% |
| Operating income | $38.3B | $35.9B |
| Operating margin | 47% | 32% |
| Cloud business revenue | $32.9B (Intelligent Cloud) | $17.7B (Google Cloud) |
| Cloud growth YoY | +29% (total segment); Azure +39% | +48% |
| GAAP diluted EPS | $5.16 | $2.82 |
Revenue growth is nearly identical — 17 percent versus 18 percent. Both have accelerating cloud businesses. Both are pouring capital into AI infrastructure. The headline numbers, viewed in isolation, would suggest the market should price them similarly.
Now look at how the market actually prices them.
Valuation snapshot (April 2026)
| Metric | Microsoft | Alphabet |
|---|---|---|
| Stock price | ~$416 | ~$342 |
| Market cap | ~$3.1T | ~$4.1T |
| P/E (trailing) | ~32x | ~31x |
| P/E (forward) | ~29x | ~22x |
| EV/Revenue (TTM) | ~10x | ~9x |
| EV/EBITDA (TTM) | ~20x | ~18x |
| 2026 YTD price performance | -14% | +15% |
On trailing P/E, the two are within one multiple point of each other. On forward P/E, a bigger gap opens: Microsoft at 29x versus Alphabet at 22x. On year-to-date price action, the divergence is sharper — Microsoft is down 14 percent, Alphabet is up 15 percent.
Something is happening between these two identical-looking cloud hyperscalers that the headline multiples half-hide and the forward multiples start to reveal. Let us decompose.
Driver 1: Growth
On trailing numbers, Microsoft and Alphabet grew almost identically last quarter — 17 percent versus 18 percent. The cloud businesses tell a different story.
Cloud segment performance — MSFT Q2 FY26 vs GOOGL Q4 2025
| Metric | Microsoft Cloud | Google Cloud |
|---|---|---|
| Quarterly revenue | $51.5B (Microsoft Cloud total) | $17.7B |
| Azure / GCP growth YoY | 39% (Azure, constant currency 38%) | 48% |
| Q+1 guidance (Azure) | 37–38% | (not guided quarterly) |
| Cloud operating margin | ~47% (segment) | 30% |
| Backlog / RPO | $625B commercial RPO (+110%) | $155B as of Q3 2025 |
Two things are visible. Google Cloud is growing materially faster (48% vs 39%) but from a much smaller base ($17.7B vs $51.5B per quarter). Microsoft's cloud business is more than three times the size of Alphabet's but growing nine percentage points slower.
This is actually a rich data point. For a valuation multiple to expand on growth, the forward growth rate matters — not the current one. Microsoft's own guidance for next-quarter Azure growth of 37–38 percent signals deceleration. Alphabet's 48 percent is accelerating from prior quarters. The multiple arithmetic is clear: if Microsoft decelerates from 39% to 35% to 30% over the next four quarters, and Alphabet holds 45%+, the market repricing should widen the forward multiple gap further.
That is precisely what has happened. Alphabet's forward P/E of ~22x versus Microsoft's ~29x reflects, in part, an expectation that GOOGL's earnings will grow faster than MSFT's earnings over the next 12 months.
How Growth Shows Up in Multiples
The historical relationship, reliable across large-cap tech:
| 3-Yr Forward Revenue Growth | Typical Forward P/E | Typical EV/Revenue |
|---|---|---|
| 0–5% | 14–18x | 2–4x |
| 5–12% | 18–25x | 4–7x |
| 12–20% | 25–32x | 7–10x |
| 20%+ | 30x+ | 10x+ |
The relationship is not linear — it is convex. Higher growth justifies multiples that expand faster than growth itself, because faster growth also implies longer runways. A 1.5x higher growth rate can justify a 2x higher multiple.
On growth alone, Microsoft and Alphabet should trade reasonably close — both are in the 12–20% growth band. They do. But they are not identical, and the next three drivers explain the rest of the gap.
Driver 2: Quality
Quality is the most underappreciated driver and the one that most often separates durable compounders from merely good businesses. It is measured in three observable things: operating margin, return on capital, and cash conversion.
Quality metrics — MSFT vs GOOGL
| Metric | Microsoft | Alphabet |
|---|---|---|
| Operating margin (TTM) | ~44% | ~32% |
| Gross margin (TTM) | ~69% | ~59% |
| ROE (TTM) | ~35% | ~32% |
| ROIC | ~27% | ~28% |
| FCF conversion | ~90% | ~75% (pressured by capex) |
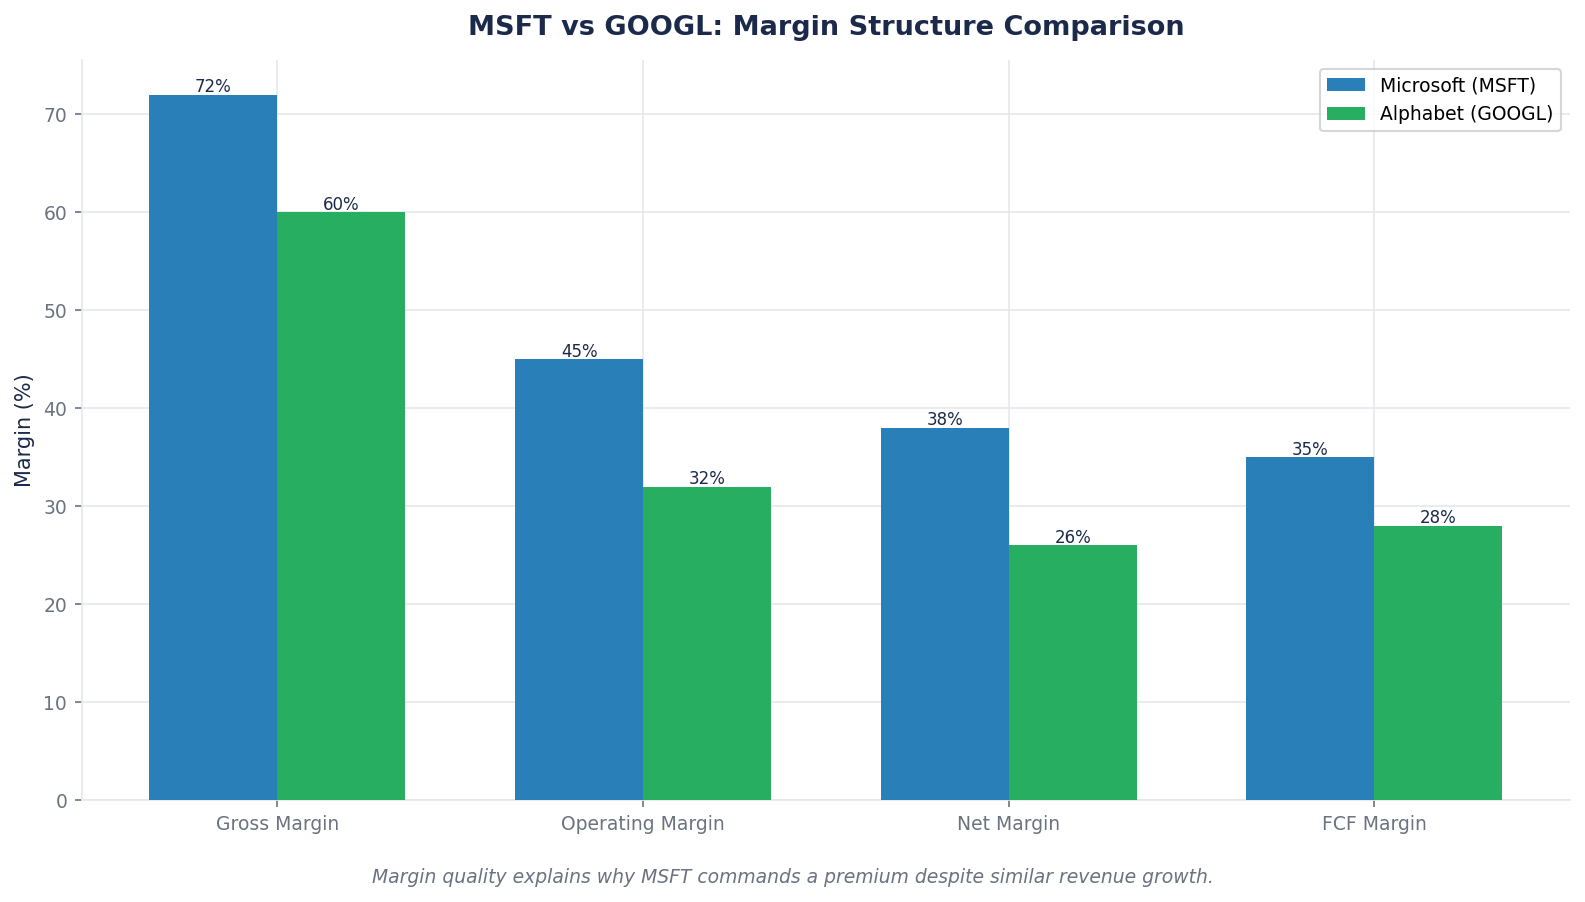
This is where Microsoft pulls clearly ahead. A 44 percent operating margin versus 32 percent — on nearly identical growth rates — is a 12 percentage point gap that compounds over every year the businesses continue.
Why? The mix. Microsoft is now approximately 60 percent software and cloud by operating income, with Office, Azure, and Dynamics earning 45–50 percent margins. Alphabet remains approximately 80 percent advertising — a high-margin business (35%+), but one where every dollar of traffic acquisition cost comes out of the P&L before operating income is measured. Microsoft also has no direct analog to Alphabet's lower-margin hardware and subscription businesses (Pixel, Nest, YouTube Premium) dragging on consolidated margins.
If growth is approximately matched, this quality gap alone would justify Microsoft trading at a premium to Alphabet. And yet, on forward P/E, Alphabet trades at a discount. So the quality driver is pushing the wrong direction relative to where current prices sit. Something else must be doing more work.
Driver 3: Risk and Durability
Risk is the driver that compresses Alphabet's multiple below where its growth and quality metrics would predict. There are two specific overhangs, and the market prices them heavily.
Antitrust. Alphabet faces active DOJ antitrust litigation over Search and has been subject to separate investigations over its adtech business. The worst-case outcomes could involve forced divestitures of Chrome, adtech stack separation, or mandated changes to the default search agreement with Apple. Each of these, in isolation, could hit revenue in the single-digit billions to low tens of billions annually. The overhang is real, and the market has been pricing it at roughly a 3–5 multiple point discount for years.
AI search disruption. The bigger structural risk is that AI-first search interfaces (including some built on Alphabet's own Gemini model) fundamentally reduce the number of sponsored clicks per query. Google Search generated roughly $200B+ of annual revenue in 2025, at margins dramatically higher than any other Alphabet business. Even a 10% impairment would be a $20B+ revenue hit. The market has been discounting this risk since 2023, which is part of why Alphabet's multiple has historically traded below Microsoft's despite comparable quality metrics.
Microsoft's risk profile is different. Microsoft has no single revenue line at Alphabet's level of concentration. Its exposure to a single regulatory action is smaller. Its AI story is additive (Copilot expanding existing Office revenue) rather than potentially cannibalizing (AI search reducing sponsored clicks). These matter.
Risk-adjusted multiple frameworks
| Risk Driver | Microsoft | Alphabet |
|---|---|---|
| Revenue concentration (largest segment) | Cloud: 41% | Search Ads: 54% |
| Regulatory exposure | Moderate (ongoing but less acute) | High (active DOJ cases) |
| AI disruption exposure | Additive | Potentially cannibalizing |
| Customer concentration | Low (millions of enterprises) | Low (billions of users) |
| Cyclicality | Low (subscription base) | Moderate (ad cycle exposure) |
This table explains most of the forward-multiple gap. Alphabet's 22x forward P/E versus Microsoft's 29x is the market pricing in roughly a 25 percent discount for the combined regulatory and AI-disruption risk. Whether the discount is correct is a separate question — but it is not random, and it is not small.
Driver 4: Capital Intensity
The last driver is the one most new investors miss because it is invisible on the income statement.
Both companies have dramatically raised their 2026 capex guidance to fund AI infrastructure. Alphabet guided to $175–185B in 2026 capex — nearly double 2025. Microsoft has publicly committed to an elevated multi-year buildout, with fiscal 2026 capex tracking toward $80B and management flagging ongoing "capacity constraints."
The question is not "who spends more." It is "whose revenue dollar requires less capital to produce."
Capital intensity — MSFT vs GOOGL (approx, TTM)
| Metric | Microsoft | Alphabet |
|---|---|---|
| Revenue (TTM) | ~$320B | ~$403B |
| CapEx (TTM) | ~$85B | ~$95B (accelerating to ~$180B in 2026) |
| CapEx / Revenue | ~27% | ~24% (rising to 45% in 2026 guidance) |
| FCF (TTM) | ~$75B | ~$75B |
| FCF / Revenue | ~23% | ~19% |
On trailing numbers the two are similar. On forward numbers they diverge dramatically. Alphabet's 2026 capex guidance of $175–185B against an expected revenue of approximately $460–480B implies capex at 38–40 percent of revenue — extraordinary for a tech business, and a clear signal that free cash flow will be compressed for at least the next 12–24 months.
Microsoft's capital intensity is also elevated but less extreme as a percentage of revenue. More importantly, Microsoft's capex goes heavily toward Azure (which earns 50%+ margins and converts revenue to FCF cleanly) while Alphabet's capex splits across Cloud (accretive), Search infrastructure (maintenance), and YouTube (competitive response to OpenAI, TikTok, Meta).
This is the capital intensity story the market has been digesting: Microsoft spends a lot, but most of the spending is going to a segment that generates high-return cash flows. Alphabet is spending more (absolute and as a percentage of revenue), with less clarity on which dollars generate the best incremental returns.
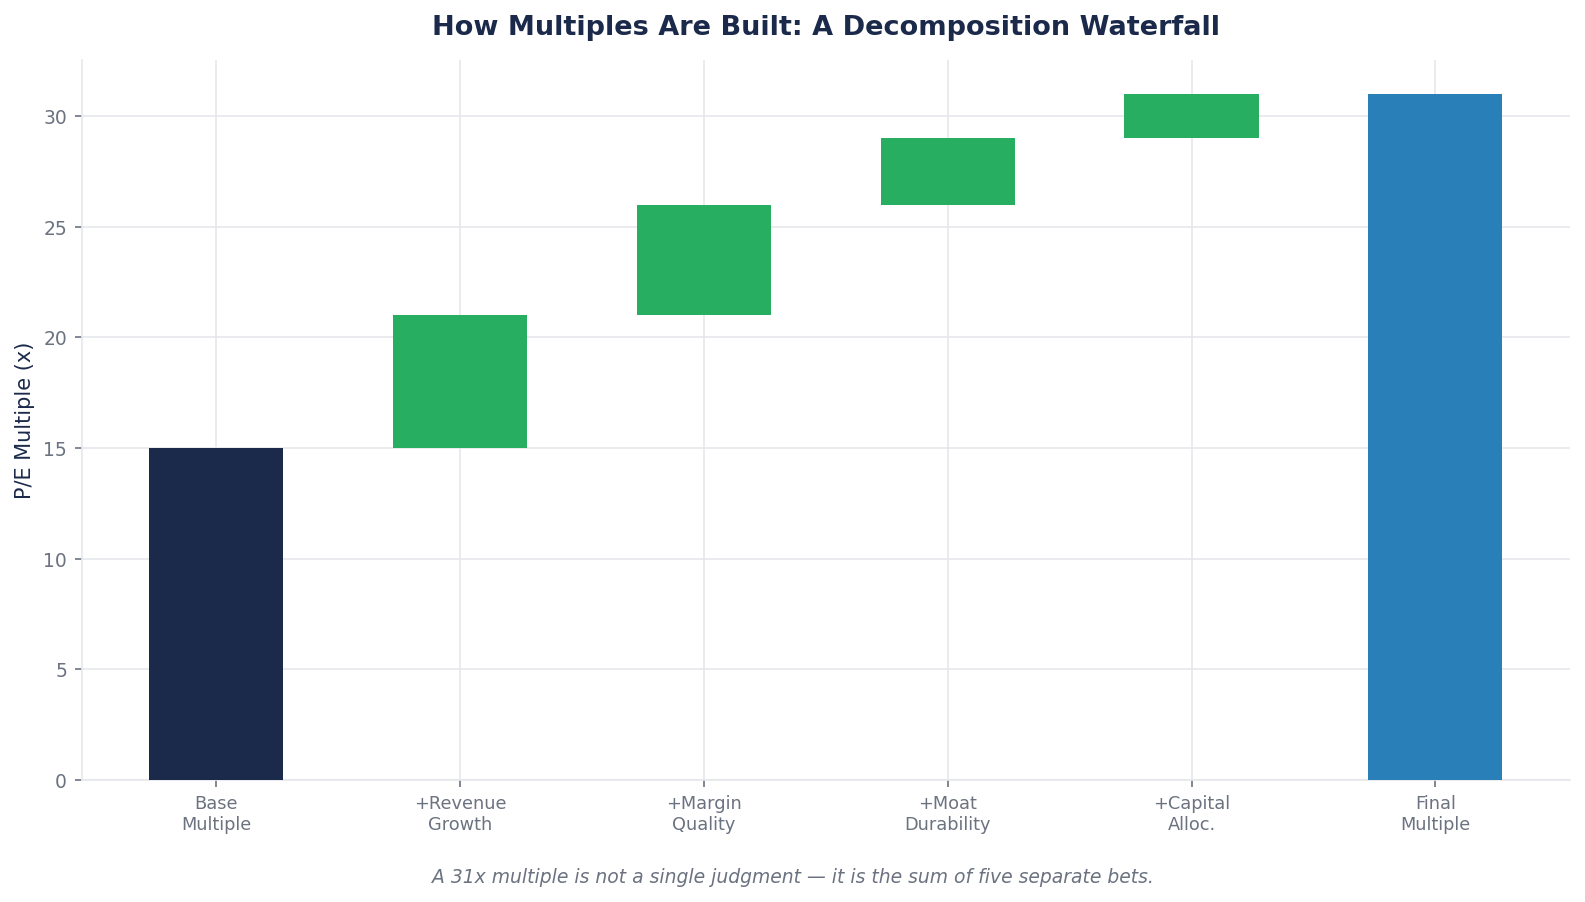
Putting It Together: What the Gap Actually Means
Here is the full decomposition of why Microsoft and Alphabet trade at nearly identical trailing multiples but diverging forward ones.
| Driver | MSFT Advantage | GOOGL Advantage | Net Impact on Forward P/E Gap |
|---|---|---|---|
| Growth | — | Slight (48% cloud vs 39% Azure) | Closes ~1 multiple point in GOOGL's favor |
| Quality | 44% op margin vs 32% | — | Opens ~3 points in MSFT's favor |
| Risk | Lower regulatory, no cannibalization | — | Opens ~3–4 points in MSFT's favor |
| Capital intensity | Higher proportion of capex to high-return segment | — | Opens ~1–2 points in MSFT's favor |
| Net | ~7 multiple points MSFT premium |
The 7-point forward-multiple gap between MSFT (29x) and GOOGL (22x) is not random. It is the market pricing in the precise combination of quality, risk, and capital-intensity differences we just walked through. Each driver contributes quantifiably to the gap.
The Contrarian Question
Here is where professional investors diverge from retail.
A professional running this decomposition concludes: "The market is right that Alphabet deserves a lower forward multiple than Microsoft. The question is whether the 7-point gap is the correct discount, or whether it is too generous or too harsh."
If the DOJ antitrust case resolves without a forced divestiture, some of the risk discount evaporates. If Gemini ad-supported search generates better unit economics than traditional Search, the AI disruption risk partially inverts into a growth positive. If the $175–185B capex translates into meaningful Cloud market share over the next 24 months, the capital intensity concern moderates. Any of those could compress the gap by 1–3 multiple points, which would translate into 5–15 percent of upside for Alphabet holders just from re-rating.
Conversely, if Azure decelerates faster than the 37–38% guidance (to 30% or below) and Microsoft's AI Copilot revenue disappoints, Microsoft could lose multiple points from the other direction. Both companies sit on top of narratives that could move the multiples in either direction over the next 12 months.
Case Study: Two Retailers, One Multiple Gap
The same framework applies outside of tech, and the spread is often even more dramatic.
Consider Costco (COST) and Target (TGT) — both large US retailers with similar revenue growth profiles in a typical year.
Illustrative snapshot (recent financial years)
| Metric | Costco | Target |
|---|---|---|
| Revenue (TTM) | ~$265B | ~$106B |
| Revenue growth (3-yr) | ~9% | ~3% |
| Operating margin | ~4% | ~5% |
| ROIC | ~22% | ~12% |
| Net cash vs debt | Net cash | Moderate debt |
| Same-store sales | Consistently positive | Mixed |
| P/E (trailing) | ~55x | ~14x |
On surface margins, Target actually has a slight edge (5% vs 4%). On revenue growth, Costco has the advantage (9% vs 3%). On the other three drivers — quality (ROIC 22% vs 12%), risk (membership-fee moat + recession-resistant demand), and capital intensity (owned membership infrastructure vs leased stores) — Costco is dramatically better.
The market prices Costco at roughly 4x Target's earnings multiple. A new investor looks at that and sees "expensive" vs "cheap." An intermediate investor sees the full decomposition: higher growth, higher quality, lower risk, and lower capital intensity all stacking on top of each other to justify a multiple that should be 4x.
Whether that specific 4x ratio is the right level — versus 3x or 5x — is where the investing work happens. But the direction and approximate magnitude of the gap is explained by the four-driver framework, not by the market being irrational.
The Common Mistake: The Single-Multiple Trap
Here is the pattern that costs intermediate investors more money than almost any other.
You decide a business is "cheap" based on one multiple — usually P/E. The P/E is 22x while the sector average is 29x. You buy. You have now made two implicit assumptions you never verified:
1. That P/E is the right multiple for this business.
2. That the sector average is the right benchmark.
Often one or both are wrong. A business with lumpy or one-time earnings items (restructuring charges, litigation settlements, tax anomalies) can have a distorted P/E that makes it look cheap or expensive on a basis unrelated to the underlying cash flows. A "sector average" computed across five businesses where two are in different sub-segments can produce a benchmark that no individual stock should actually be measured against.
For the MSFT vs GOOGL case, the specific trap is this: "Alphabet is cheaper than Microsoft on forward P/E, so Alphabet is the better buy." That statement has taken money from real retail investors for years. The 7-point forward multiple gap is largely explained by structural differences the investor has not priced in. Buying GOOGL because it is "cheaper" than MSFT on one ratio — without weighing quality, risk, and capex exposure — is mistaking a price label for a bargain.
The fix is to never rely on a single multiple. Pull at least three: P/E, EV/EBITDA, EV/FCF. See if they all point the same way. If they agree, you have a real signal. If they disagree, something is distorting one of them and you need to find out what before you trade.
For software and hyperscalers, substitute EV/Revenue, Rule of 40 (growth + operating margin), and FCF yield. For banks, substitute P/B, P/TBV, ROE. The principle is the same: triangulation beats a single number every time.
What to Watch
Three habits turn comp analysis from a ranking exercise into a real analytical tool.
Always decompose the spread. When you see two companies in the same industry with different multiples, resist the urge to rank them. Write down how much of the spread is explained by each of the four drivers — growth, quality, risk, capital intensity. If the decomposition fully accounts for the gap, the market is pricing efficiently. If it does not, you have found something to investigate.
Watch for regime shifts, not just name-level changes. Comps will confidently tell you a stock is "fairly valued" at peer multiples, right up until the entire sector re-rates. When hyperscaler capex as a percentage of revenue crossed 30% for the group in 2025–2026, the forward multiples of the entire category compressed together — regardless of which specific name you owned. Absolute methods like DCF are what tell you whether the whole pack is overextended, not just who is cheap within it.
Rebuild the comp set at least annually. Multiples drift. A comp set that was valid two years ago may include companies that have been acquired, changed business models, or become fundamentally different. A peer group is useful only as long as the peers are still peers. If Google Cloud grows to rival AWS and Azure in scale over the next 24 months, the comparison set for "Alphabet" changes — it starts to look more like a pure hyperscaler and less like a consumer-internet-plus-cloud hybrid. When the business mix shifts, the peer set has to shift with it.
Brutal Edge Coverage Integration
This week's framework maps directly onto our coverage:
- Microsoft Deep Dive (BEAF 81/B+) — full quality and risk decomposition, including the specific Azure vs AWS competitive positioning and Copilot revenue runway. The margin and capex analysis in that report applies the exact framework built here.
- Alphabet Deep Dive (BEAF 78/B) — the DOJ antitrust scenarios quantified, AI search disruption modeled, and the Google Cloud trajectory against hyperscaler peers. Our sub-80 score reflects exactly the risk-discount story this week surfaced.
- Physical AI Sector Report — hyperscaler capex cycle ($700B combined estimate for 2026) and how the AI infrastructure buildout flows into the multiples of every hyperscaler simultaneously.
- NVDA Deep Dive (BEAF 83/B+) — the cleaner case where a single company captures most of the value added by hyperscaler capex. Useful as a contrast — NVDA's multiple rewards, MSFT and GOOGL's multiples partially absorb the cost.
For additional frameworks, see our Deep Dive archive. Every name we cover is run through the four-driver decomposition before scoring.
Looking Ahead
This week closes the valuation module. Over the next three weeks we move from how to price a business to something deeper — what actually makes a business worth more than its industry peers in the first place. This is the question of competitive advantage, or what investors call the moat.
Most "moats" in the real world turn out not to be moats at all. A handful of them are real, durable, and explain the vast majority of long-term compounding winners. Next week we identify the five competitive advantages that actually behave like moats — meaning they persist for decades, widen with scale, and are measurable in the financial statements — with real examples from Visa, Microsoft, Costco, Adobe, and UnitedHealth. Knowing which advantages qualify and which are pretenders is one of the highest-leverage skills an investor can develop.
For now, sit with this week's lesson. A multiple is not a price tag. It is a compressed summary of four things the market believes about a business. Learn to unpack it, and you stop buying "cheap" stocks that are cheap for reasons you could have seen.
Brutal Edge. Frameworks over forecasts. Signal over noise.
Disclaimer. Brutal Edge is an independent investment research platform. This report is published for educational and informational purposes only and does not constitute investment advice, a recommendation to buy or sell any security, or an offer to transact in any financial instrument. All valuations, forecasts, and opinions are the analyst's own and are subject to change without notice. Past performance does not guarantee future results. Readers should conduct their own due diligence and consult a qualified financial professional before making investment decisions.
Educational content only. Not investment advice. Always do your own research.