DCF: The Spreadsheet That Lies to You
NVIDIA reported $215.9 billion in revenue, a 71 percent gross margin, and $97 billion in free cash flow. Run a standard DCF and the model says the stock is overvalued by 30 to 60 percent. The stock has compounded at 30 percent per year for five years. This week we find out why the spreadsheet lies — and what to do instead.
DCF Reality Check
Last week we ran three valuation methods on Tesla and watched them disagree by a factor of ten. That was the hard case — a business priced almost entirely on narrative, where DCF could not anchor itself to cash flows that do not yet exist.
This week we take the cleaner case. NVIDIA is now a $4.8 trillion company. It just reported the strongest fiscal year in modern corporate history: $215.9 billion in revenue (up 65 percent year over year), $120 billion in net income, a 71 percent full-year gross margin, and $97 billion in free cash flow — more than Tesla has generated cumulatively in its entire existence as a public company. Return on invested capital sits at 126 percent. The company has effectively no net debt.
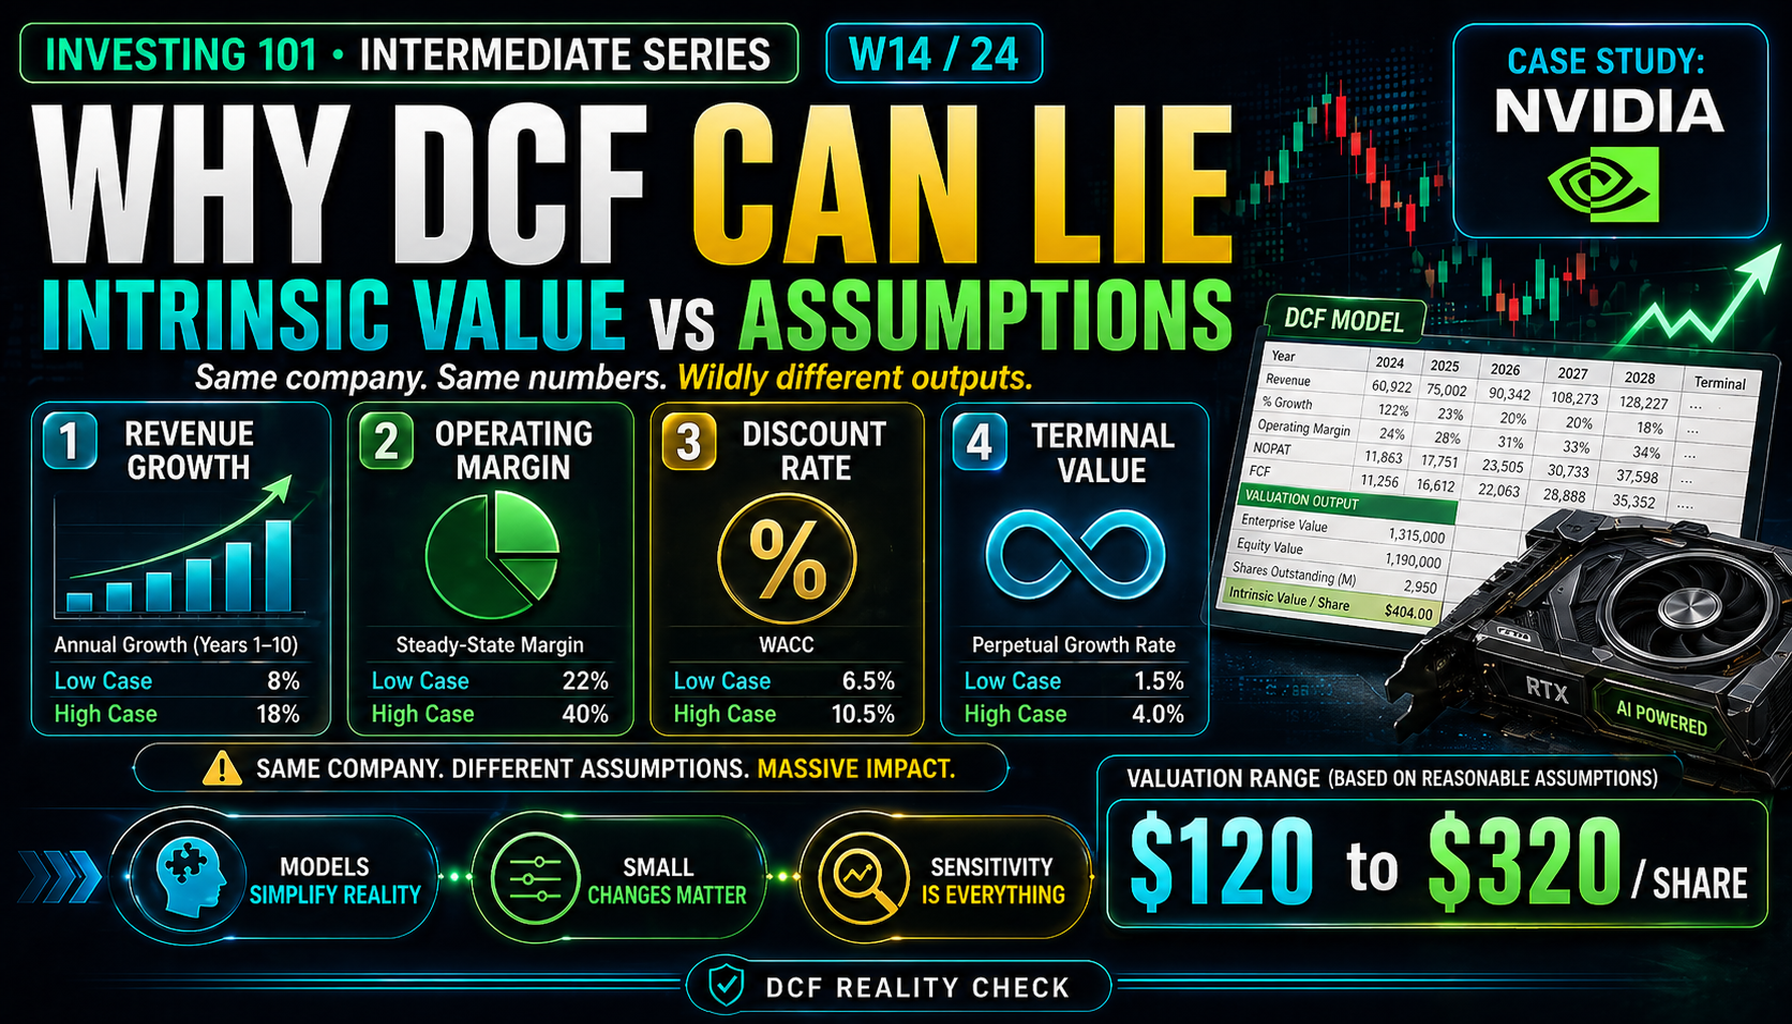
If DCF is going to work anywhere, it should work here. The cash flows are enormous, measurable, and growing in a straight line. And yet, when you actually build the model, it will produce an "intrinsic value" that ranges from $120 to $320 per share depending on assumptions no one can prove right or wrong. The stock currently trades around $200.
That range is not a failure of the tool. It is the truth about how DCF actually behaves, exposed cleanly because everything else about NVIDIA is quantitatively visible. This week we build the model, torture each assumption, and learn where DCF helps you think and where it quietly misleads you.
Core Framework: The Four Knobs That Actually Matter
A DCF has dozens of inputs. Most of them barely matter. Four of them move the answer almost completely.
| Input | Where It Lives in the Model | How Much It Moves the Answer |
|---|---|---|
| Revenue growth rate | Years 1–5 projection | Moderate |
| Operating margin | Years 1–5 projection | Moderate |
| Discount rate (WACC) | Applied to every cash flow | Extreme |
| Terminal growth rate | Terminal value formula | Extreme |
The first two matter, but if you are reasonable about them the output stays within a predictable band. The second two are the real levers. Change WACC by 100 basis points and your valuation moves 15 to 25 percent. Change the terminal growth rate from 2 percent to 3 percent — a single percentage point that looks trivial on the page — and the valuation can move 30 percent or more.
Anyone who has built a serious DCF knows this. Almost nobody admits it in print. So let us admit it in print, using NVIDIA as the example.
Building the NVDA Model: Start With What We Know
Here is the factual starting point, from the Q4 FY2026 earnings report filed February 25, 2026.
| Metric | FY2026 (full year) | FY2026 Q4 alone |
|---|---|---|
| Total revenue | $215.9B | $68.1B |
| Data Center revenue | $193.7B | $62.3B |
| Gross margin (GAAP) | 71.1% | 75.0% |
| Operating margin (approx.) | 62% | 65% |
| Net income | $120.1B | $43B |
| Free cash flow | $97.0B | $35.0B |
| GAAP diluted EPS | $4.90 | $1.76 |
| Shares outstanding | 24.3B | |
| Q1 FY27 revenue guidance | $78.0B (±2%) | (implies ~55% YoY growth) |
Management has also publicly referenced a $500 billion Blackwell + Rubin revenue opportunity through end of calendar 2026 and indicated sequential growth continues throughout the year. That is a forward data point, not a fact — but it is a specific commitment from management, not a guess.
Projecting 2027–2031
Here is a concrete five-year forecast using assumptions a reasonable bull would defend in a research note. Revenue decelerates gradually as the law of large numbers kicks in. Operating margin compresses slightly as competition from custom silicon (Google TPU, Amazon Trainium, Marvell/Alphabet partnership) and AMD MI-series erodes the near-monopoly. CapEx stays elevated to support Rubin rollout.
| Year | Revenue | Growth | Op Margin | EBIT | Tax (15%*) | NOPAT | + D&A | – CapEx | – ΔWC | FCF |
|---|---|---|---|---|---|---|---|---|---|---|
| FY27 | $320B | 48% | 62% | $198B | $30B | $168B | $9B | $18B | $12B | $147B |
| FY28 | $420B | 31% | 60% | $252B | $38B | $214B | $11B | $22B | $15B | $188B |
| FY29 | $500B | 19% | 58% | $290B | $44B | $247B | $13B | $24B | $12B | $224B |
| FY30 | $560B | 12% | 55% | $308B | $46B | $262B | $14B | $25B | $9B | $242B |
| FY31 | $610B | 9% | 53% | $323B | $48B | $275B | $15B | $25B | $8B | $257B |
*NVIDIA's effective tax rate has historically run 13–17% due to geographic mix and R&D credits; 15% used here.
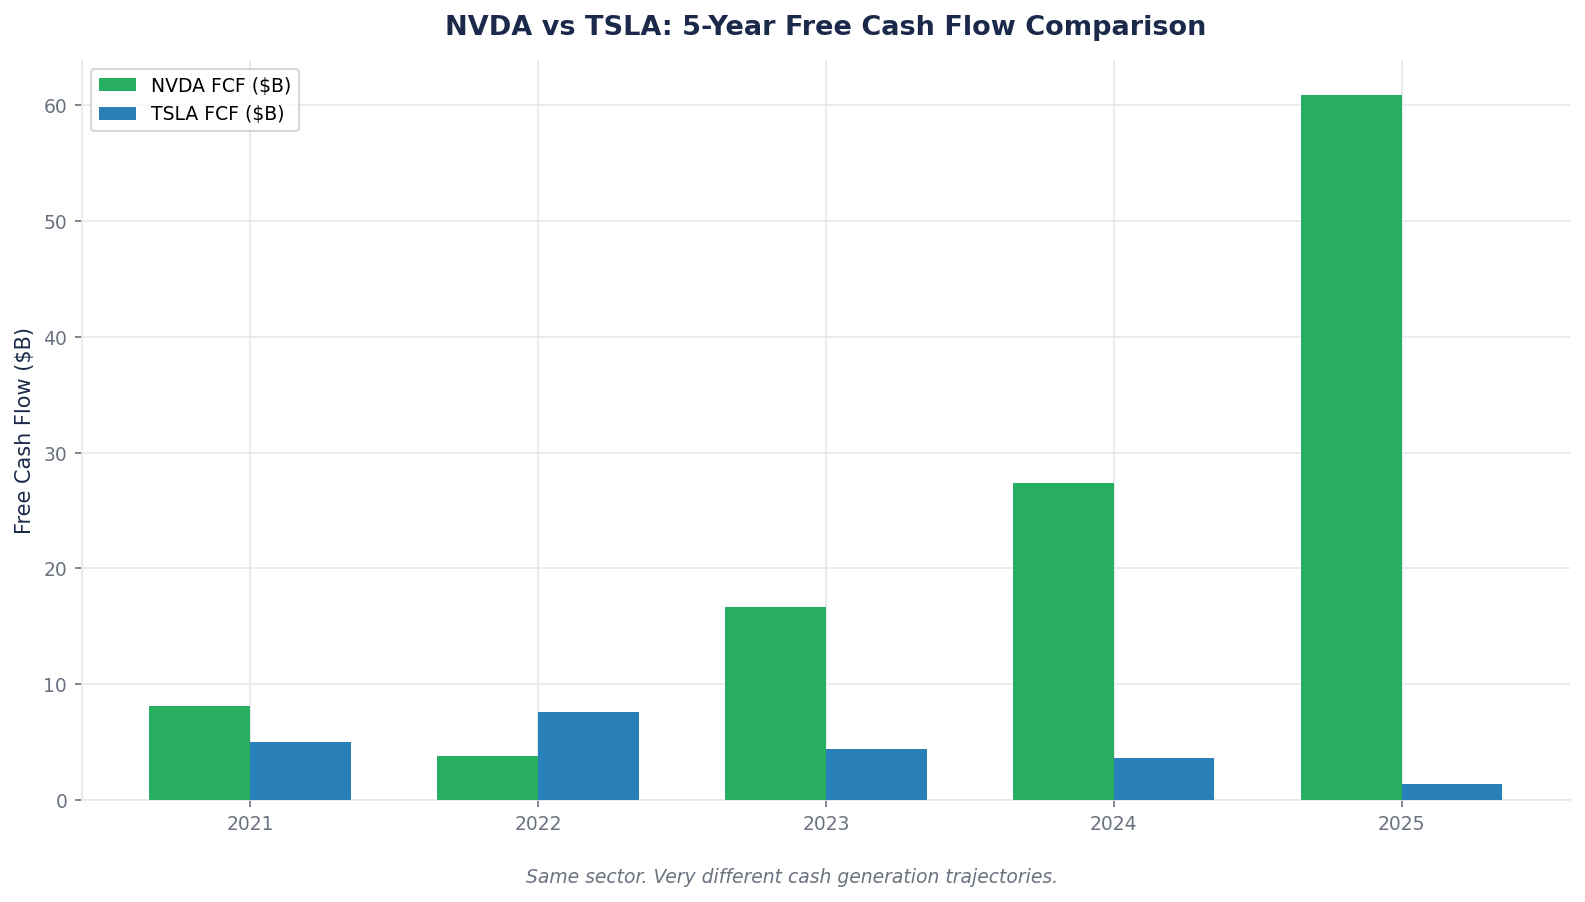
Two things stand out when you put this table next to last week's TSLA forecast. First, NVDA produces more free cash in a single year (FY27: $147B) than Tesla's cumulative free cash flow over the last decade. Second, the forecast is a deceleration story, not a ramp story — the DCF answer will be dominated by the rate at which growth slows, not by whether it eventually turns positive.
Calculating the Terminal Value
After FY31, assume the business settles into steady state: 4 percent perpetual growth (higher than GDP because AI infrastructure is a multi-decade build-out), 45 percent operating margin (materially lower than today as maturity sets in). Using a WACC of 10 percent (NVIDIA's beta is 2.33, so we need a higher equity risk premium than on a consumer staples name):
| Component | Value |
|---|---|
| Terminal year FCF (FCF_FY31) | $257B |
| Terminal growth rate (g) | 4% |
| WACC (r) | 10% |
| r − g | 0.10 − 0.04 = 0.06 |
| FCF × (1 + g) | $257B × 1.04 = $267.3B |
| Terminal Value | $267.3B ÷ 0.06 = $4,454B |
Discounting Everything Back to Today
| Year | FCF | Discount Factor (10%) | Present Value |
|---|---|---|---|
| FY27 | $147B | 0.909 | $134B |
| FY28 | $188B | 0.826 | $155B |
| FY29 | $224B | 0.751 | $168B |
| FY30 | $242B | 0.683 | $165B |
| FY31 | $257B | 0.621 | $160B |
| Terminal Value | $4,454B | 0.621 | $2,766B |
| Enterprise Value | $3,548B | ||
| + Cash & investments | $50B | ||
| – Debt | ($10B) | ||
| Equity Value | $3,588B | ||
| ÷ Shares (24.3B) | |||
| DCF Value per share | $148 |
NVDA closed April 23 near $200 per share. This base-case DCF produces a fair value of $148 — about 26 percent below the current price. The model says NVDA is moderately expensive on these assumptions.
A Tesla bull will immediately notice what just happened. TSLA's DCF last week produced $92 versus a $373 stock — a 4.1x gap. NVDA's DCF produces $148 versus a $200 stock — a 1.35x gap. For a business of NVDA's scale and cash generation, that is a far narrower, more workable valuation gap. DCF is actually doing something here.
But now watch it lie.
Now Watch the Model Lie
Experiment 1: Move the Discount Rate
Hold everything else constant. Only WACC changes.
| WACC | Fair Value per Share | % Change from Base |
|---|---|---|
| 8.0% | $211 | +43% |
| 9.0% | $176 | +19% |
| 10.0% | $148 | Base |
| 11.0% | $126 | –15% |
| 12.0% | $108 | –27% |
A single percentage point on WACC moves the answer by roughly 15 to 25 percent. At 8 percent WACC, the DCF says NVDA is undervalued at $200. At 12 percent, it says NVDA is 46 percent overvalued. Same company. Same cash flows. Same growth assumptions. Just a different discount rate.
What is the "correct" WACC for NVIDIA? The academic answer involves the risk-free rate, equity risk premium, beta, and cost of debt. In practice, respectable analysts looking at NVDA today land anywhere from 8 to 11 percent depending on how they treat the beta (trailing 2.33 vs. normalized ~1.5) and the equity risk premium (historical 5% vs. forward-looking 6%). That legitimate disagreement alone produces a 70 percent spread in fair value. Every one of those analysts believes they are using the right number.
Experiment 2: Move the Terminal Growth Rate
Hold WACC at 10%. Change only the terminal growth assumption.
| Terminal Growth | Fair Value per Share | % Change from Base |
|---|---|---|
| 2.0% | $108 | –27% |
| 3.0% | $126 | –15% |
| 4.0% | $148 | Base |
| 5.0% | $182 | +23% |
| 6.0% | $236 | +59% |
A single percentage point on terminal growth moves the answer by 15 to 25 percent. And terminal growth is arguably more arbitrary than WACC — you are guessing what a company will grow at forever, starting six years from now, based on essentially no data.
For NVIDIA specifically, the terminal growth question is unusually difficult. If AI infrastructure is a multi-decade build-out comparable to electrification or the internet, 5–6 percent perpetual growth is defensible. If it is a more conventional semiconductor cycle that eventually plateaus, 2–3 percent is closer to reality. The answer depends entirely on your view of a technology cycle that does not yet have a historical analog, and the DCF forces you to bet on that view with a single number.
Experiment 3: Combine the Two
Now watch both move together. Here is the sensitivity table an honest analyst would put at the bottom of their model.
NVDA fair value per share, sensitivity to WACC and terminal growth
| g = 2% | g = 3% | g = 4% | g = 5% | g = 6% | |
|---|---|---|---|---|---|
| WACC 8% | $138 | $166 | $211 | $290 | $460 |
| WACC 9% | $122 | $142 | $176 | $230 | $330 |
| WACC 10% | $108 | $126 | $148 | $182 | $236 |
| WACC 11% | $96 | $110 | $126 | $150 | $186 |
| WACC 12% | $86 | $98 | $108 | $124 | $148 |
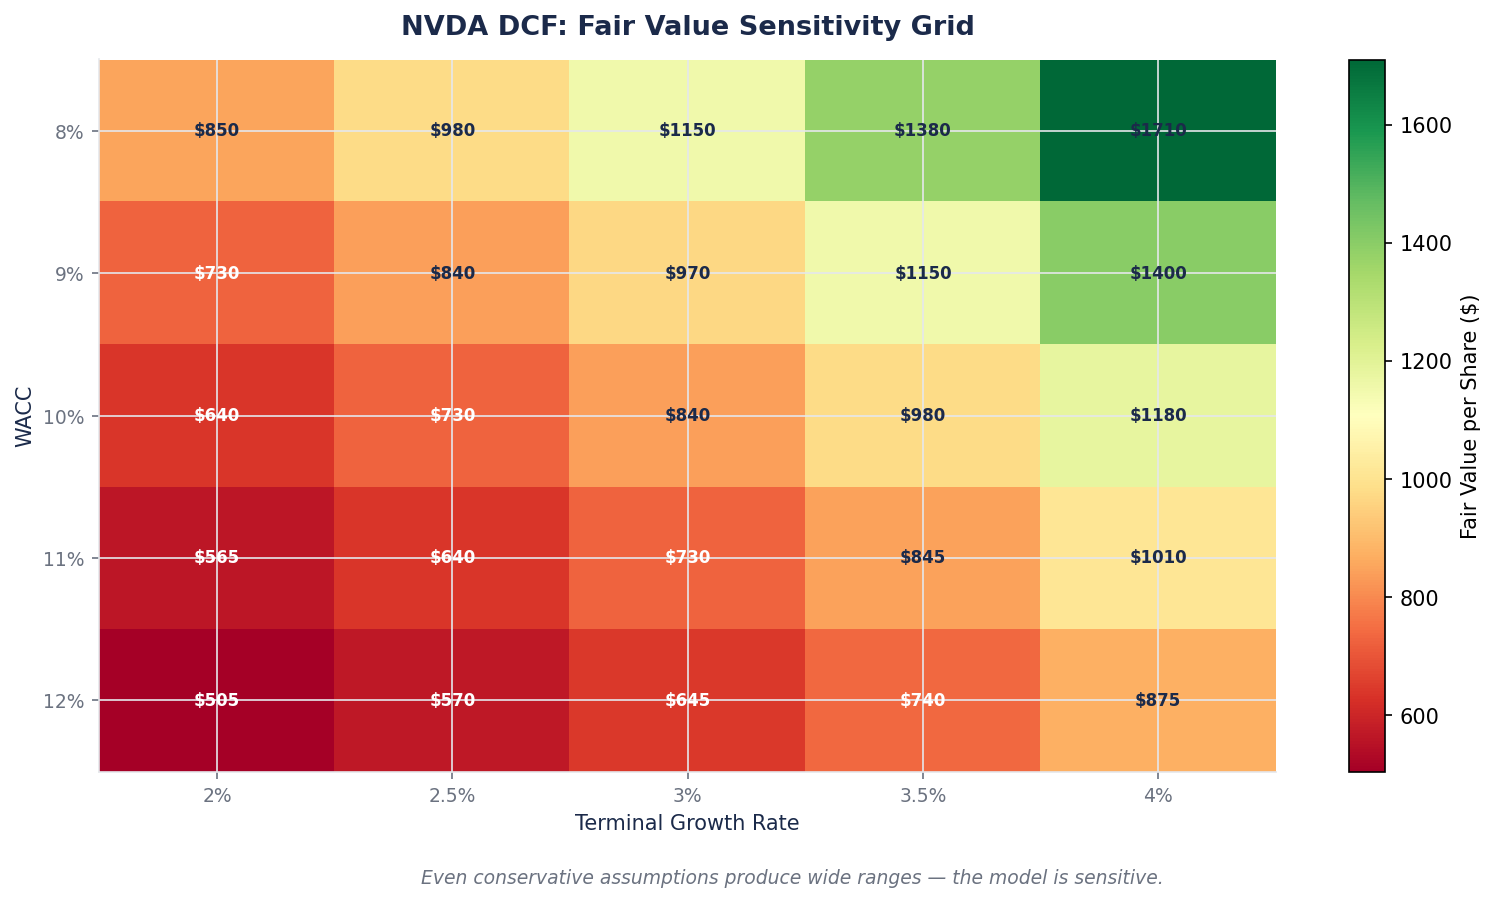
Across the reasonable range — WACC 8 to 12 percent, terminal growth 2 to 6 percent — the DCF value runs from $86 to $460 per share. A 5x spread. The midpoint is roughly $160.
Narrow the range to what most analysts would actually defend — WACC 9 to 11 percent, terminal growth 3 to 5 percent — and the range compresses to $110 to $230. Still more than 2x, for identical revenue projections, identical margins, identical capex, identical everything else. The only things that changed were two numbers no one can prove right or wrong.
This is not a failure of DCF. This is how DCF actually works, and professionals who use it honestly always report a range like the one above rather than a single-point estimate. The ones who report a single point and act confident about it are either misleading you or misleading themselves.
Where Terminal Value Hides the Real Story
Look back at the base-case present value table. The five forecast years contribute $782B of present value. The terminal value contributes $2,766B. That means 78 percent of the "intrinsic value" comes from the period we did not actually forecast.
Read that again. The work we did — building out five years of revenue, margins, capex for one of the most forecasted companies on earth — contributes roughly one quarter of the answer. The work we did not do — the perpetual period from FY32 to infinity, compressed into a single Gordon Growth formula — contributes three quarters.
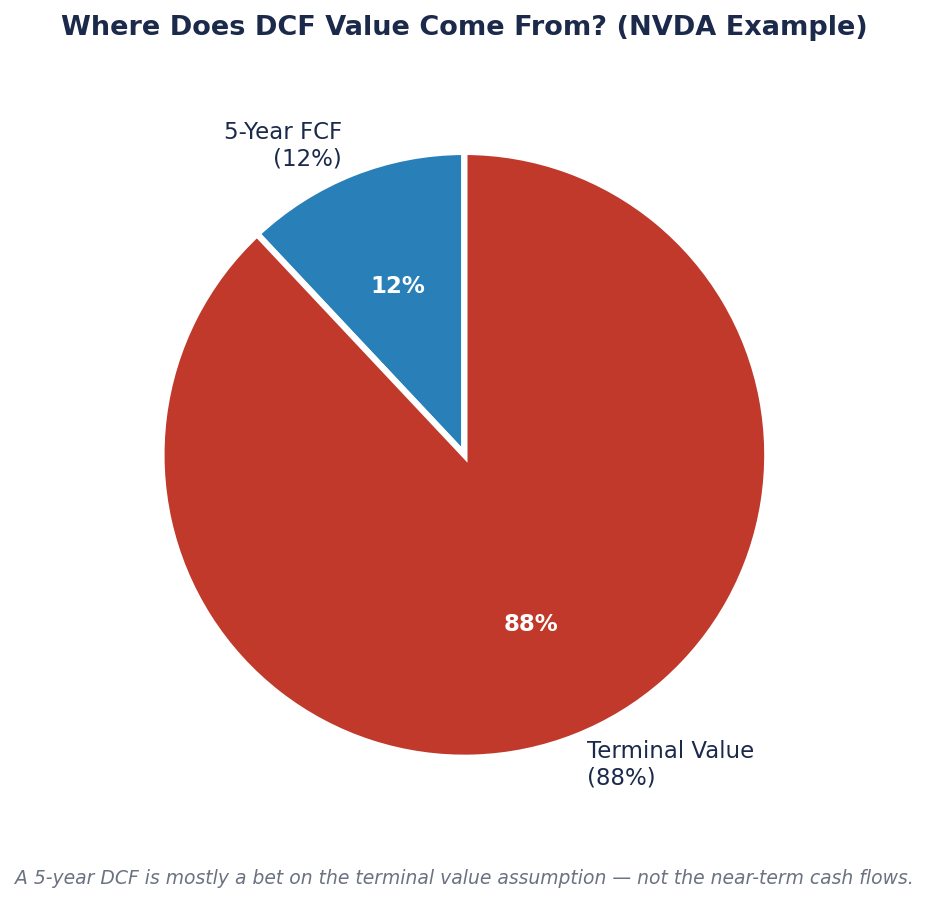
For fast-growing companies this split gets worse, not better. A DCF on NVIDIA is not really "valuing five years of AI infrastructure buildout." It is mechanizing a perpetuity assumption about what NVIDIA looks like in the 2030s, 2040s, and beyond — an assumption compressed into two numbers (terminal growth, WACC) — and dressing it up with five years of detail in front.
This is the quiet truth about DCF that experienced investors internalize and others miss. The spreadsheet looks like it is forecasting cash flows. What it is actually doing is pricing a perpetuity, with a five-year runway of carefully-calculated precision glued to the front for psychological comfort.
Case Study: NVIDIA at Three Points in Time
DCF is most useful not as a single-point valuation tool but as a consistency tool across time. Run the same model at different moments and the story the assumptions tell becomes the real signal.
NVDA DCF snapshot at three moments (illustrative, same methodology):
| Date | Stock Price | TTM Revenue | Required Terminal Growth to Justify Price | What the Assumption Meant |
|---|---|---|---|---|
| Jan 2023 (pre-ChatGPT) | ~$14 (split-adj.) | $27B | ~3% | Modest growth assumption, DCF easily justified price |
| Early 2024 | ~$60 (split-adj.) | $61B | ~4% | Still defensible |
| Late 2024 | ~$140 | $113B | ~5% | Aggressive but plausible |
| Apr 2026 | ~$200 | $216B | ~5–6% | Requires betting AI infrastructure is a 15+ year cycle |
The DCF does not tell you whether NVIDIA is cheap or expensive. What it does tell you is what assumption you have to believe to defend the price at any given moment. In 2023, the required belief was "decent semiconductor growth." In 2026, the required belief is "AI infrastructure spend remains elevated for another decade-plus."
Both of those might be true. But they are very different statements about the future, and they carry very different risks. A DCF forces you to be explicit about which one you are betting on.
The Common Mistake: The Confirmation Loop
Here is the single most destructive pattern among intermediate investors using DCF.
You like a stock. You want to buy it. You build a DCF. The output says it is 15 percent undervalued. You buy with conviction. A few months later the stock is down. You rebuild the DCF. The output says it is now 30 percent undervalued. You buy more. Eventually the stock is down 60 percent and your model still says undervalued.
What happened? At each step, when you re-ran the model, you left your assumptions mostly intact. Revenue growth: still 40 percent. Margins: still expanding. Discount rate: still 9 percent. The only thing that changed was the stock price, so of course the output looked even more "attractive."
This is the confirmation loop. A DCF that starts from a conclusion and produces numbers to match it. The model is not wrong. The input was wrong the whole time.
For NVDA specifically, the confirmation loop looks like this: you run a DCF in 2024 with 5% terminal growth and get a fair value above the current price. You buy. The stock doubles. You re-run in 2026. You leave the 5% terminal growth in place because "the AI story is still intact." The DCF still says fair value. But the price has moved 100 percent and none of your assumptions tightened. You have stopped testing the thesis — you are just re-running the same calculator with a bigger denominator.
The fix is structural. Before you run a DCF, write down the three assumptions that would make you change your mind: the revenue growth number below which this thesis breaks, the margin number below which the business is impaired, the discount rate above which the math stops working. If any of those break — and you will only notice if you wrote them down — your DCF output is no longer your friend. It is lying to you.
Honest analysts document their kill criteria before they build the model. They almost never publish them. You can do this in your own notes.
What to Watch
Three practical habits will turn DCF from a seduction into a useful tool.
Always report a range, never a point. If anyone — including you — hands you a DCF that says "fair value is $164.80," ask for the sensitivity table. If there is no sensitivity table, the model is not finished. The range across reasonable WACC and terminal growth assumptions is the actual answer. For NVDA today that range is roughly $110 to $230. That is the honest number. Anything more precise is fiction.
Decompose the value. Before trusting a DCF output, split it into "present value of years 1–5" and "present value of terminal." If terminal is more than 75 percent of the total — which it is for NVDA at 78 percent — treat the model as a disguised perpetuity calculation and weigh it accordingly. You are not valuing explicit cash flows. You are valuing an assumption about the 2030s.
Stress test the assumption you feel most confident about. Counterintuitively, the biggest blow-ups in DCF models come from the inputs you did not question because they seemed obvious. "Revenue growth will decelerate but stay high" — until Google's TPU, Amazon's Trainium, and AMD's MI400 collectively cut NVIDIA's share faster than expected. "Margins will hold at 55%+" — until customers achieve enough custom-silicon leverage to negotiate prices down. Pick the assumption that feels most solid and halve it. If the valuation still works at that level, the thesis is robust. If it does not, you have been leaning on a single load-bearing assumption.
Brutal Edge Coverage Integration
This week's framework maps directly onto our coverage:
- NVDA Deep Dive (BEAF 83/B+) — the full DCF sensitivity, competitive positioning against custom silicon (TPU, Trainium, MI-series), and the specific scenarios that move the terminal growth assumption from 3% to 5%. The base-case model in that report is the one we rebuilt here.
- Physical AI Sector Report — covers the $500B Blackwell + Rubin opportunity, hyperscaler capex trajectory ($700B combined estimate for 2026), and the structural question of how long the AI buildout cycle sustains above-trend growth.
- TSLA Deep Dive Rev.2 (BEAF 58/C+) — the direct counterpoint. Where NVDA's DCF actually works as a tool (narrow gap, defensible cash flows), TSLA's DCF collapses because nothing is measurable. Reading the two together is the clearest way to understand when DCF deserves weight and when it does not.
- Anthropic Private Investor Report — the category above even TSLA, where DCF cannot be applied at all and a completely different valuation framework is required.
For additional frameworks, see our Deep Dive archive.
Looking Ahead
Next week we move from DCF to the other end of the spectrum: comparable company analysis, and specifically the question of why two companies in the exact same industry, with nearly identical financials, can trade at wildly different multiples. We put Microsoft next to Google — both Mag 7, both hyperscalers, both with cloud businesses growing at double digits — and watch the market price them differently. That gap, same business, different multiple, is where a lot of real investing edge actually lives. It is rarely an accident, and it is never random.
For now, sit with this week's lesson. A DCF is a story you tell about the future, formalized in math. For NVIDIA the math is honest and the story is unusually measurable. For most other companies it is neither. Knowing the difference is what separates a tool from a trap.
Brutal Edge. Frameworks over forecasts. Signal over noise.
Disclaimer. Brutal Edge is an independent investment research platform. This report is published for educational and informational purposes only and does not constitute investment advice, a recommendation to buy or sell any security, or an offer to transact in any financial instrument. All valuations, forecasts, and opinions are the analyst's own and are subject to change without notice. Past performance does not guarantee future results. Readers should conduct their own due diligence and consult a qualified financial professional before making investment decisions.
Educational content only. Not investment advice. Always do your own research.