When to Sell. The Hardest Decision in Investing.
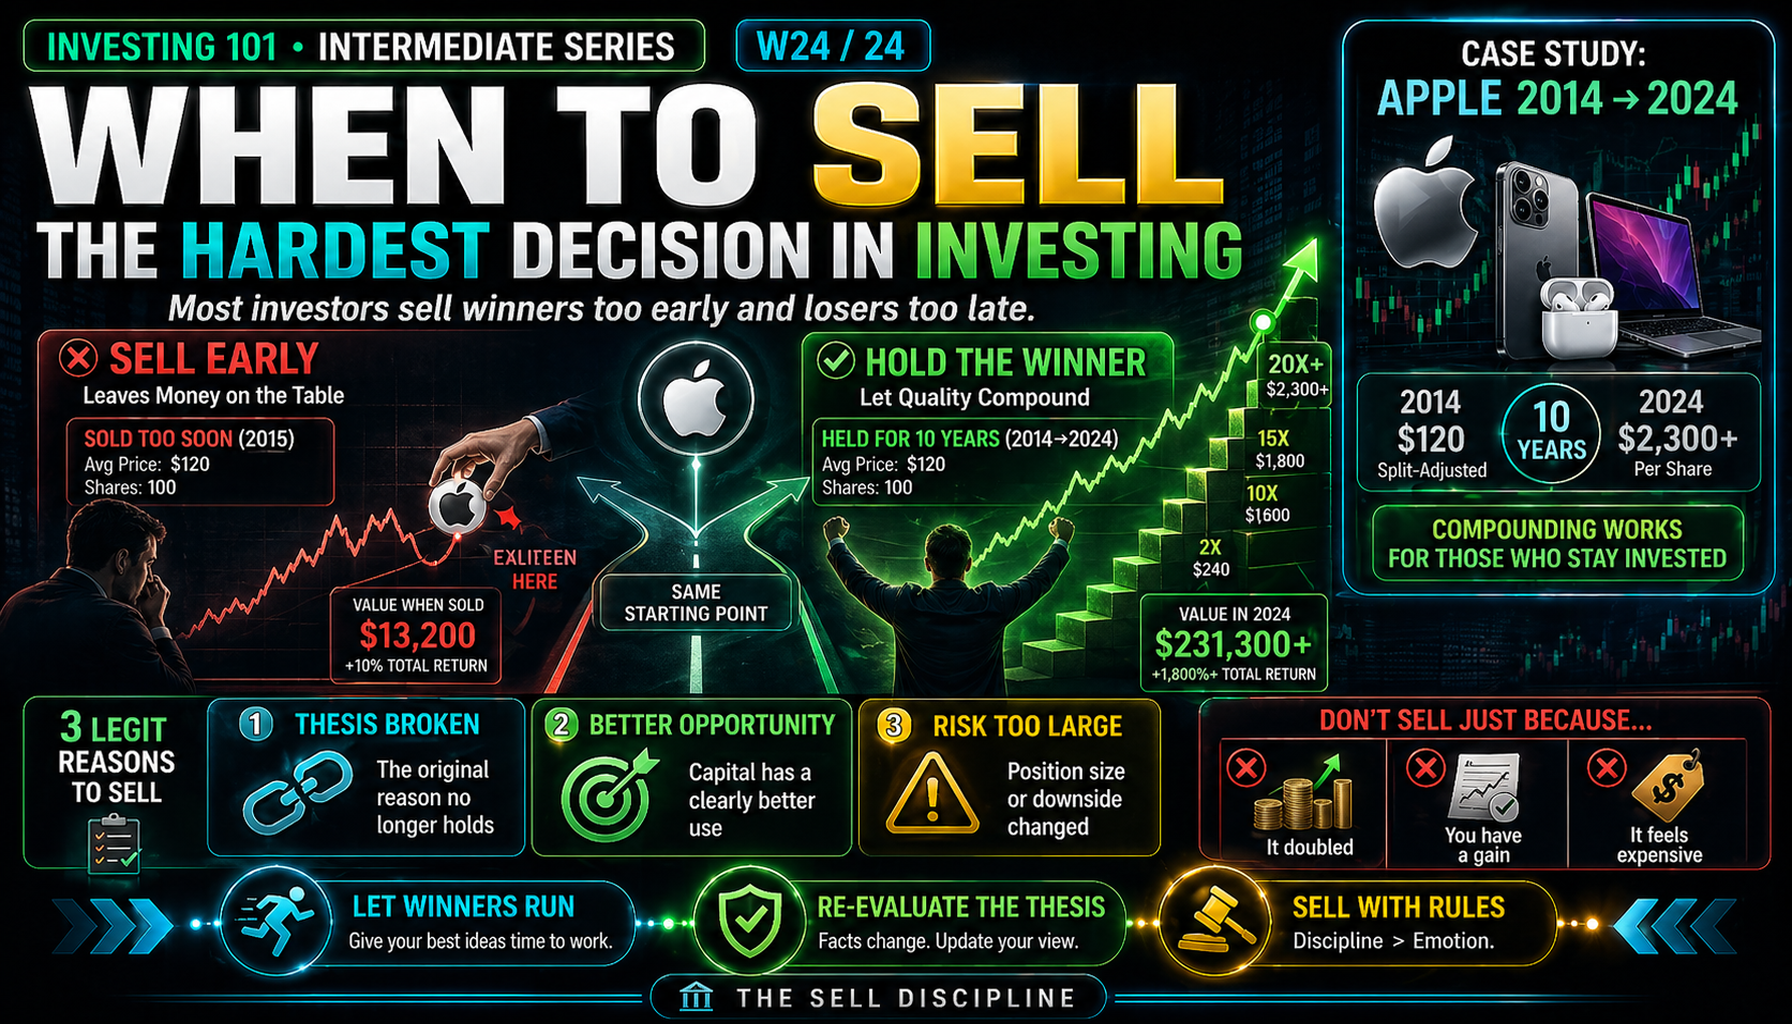
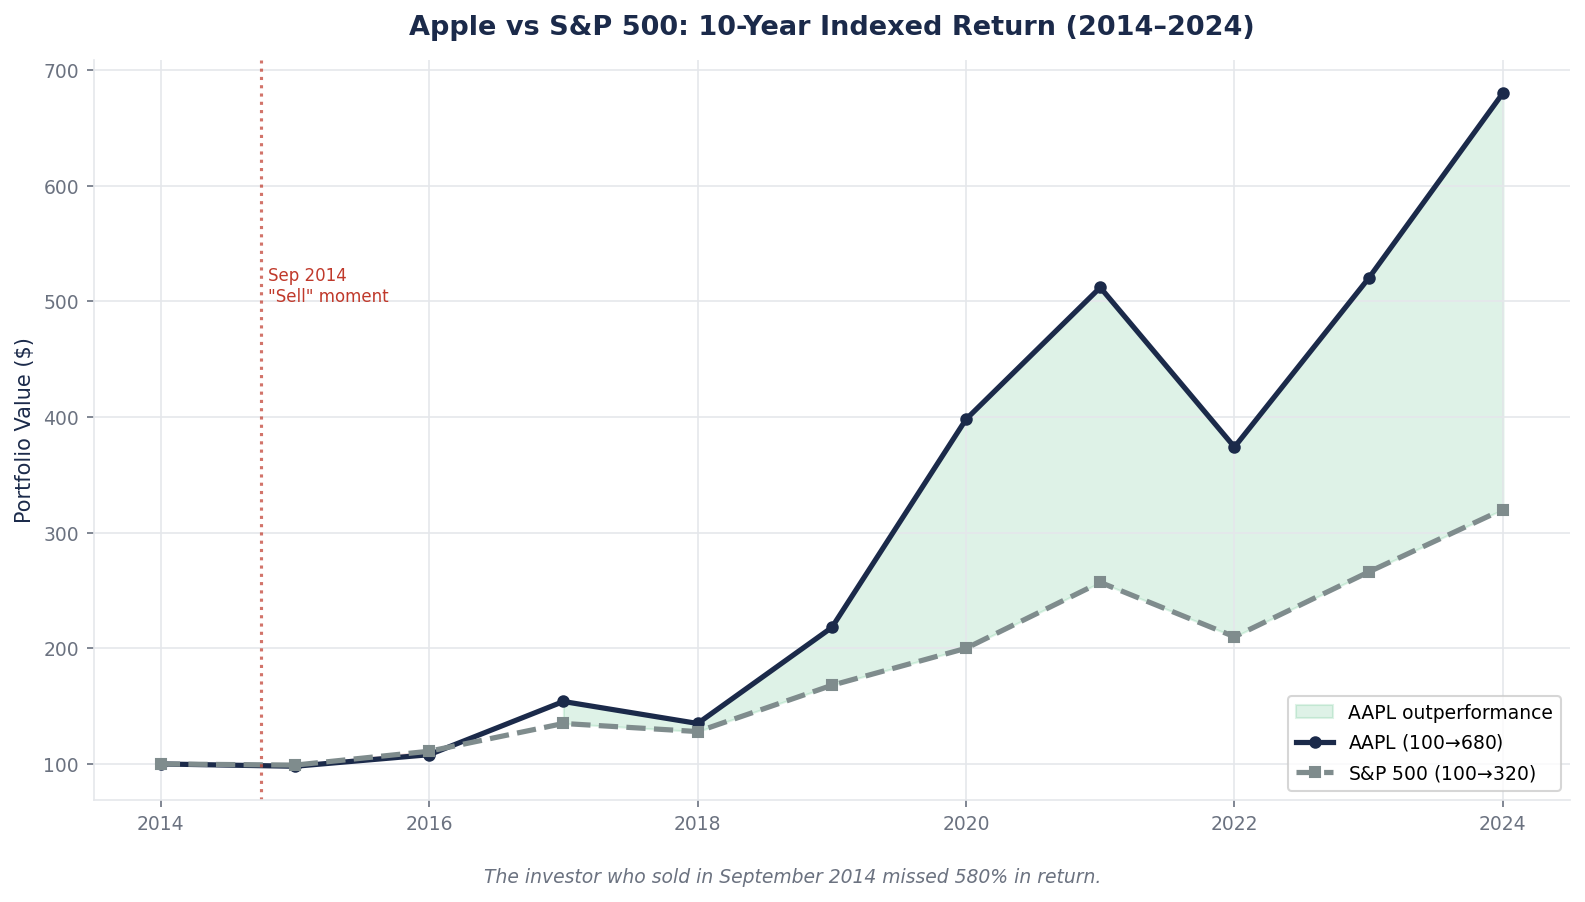
In September 2014, Apple had just finished a 100 percent run from its 2013 lows. Two investors held identical positions. One sold. One held for another decade. By 2024, the holder had 14x'd their money. This week we build the three-part framework for when selling is and is not the right decision.
When to Sell
You have done the work. You found the business. You valued it. You evaluated the moat. You sized the position. You diversified the portfolio. The stock has run up 80 percent. Now the hardest question in investing lands on you: do you sell?
Most retail investors answer this question poorly. The pattern is consistent and documented. They sell winners too early (to "lock in gains") and hold losers too long (because they are "going to come back"). Both errors come from the same underlying problem: treating the sell decision emotionally rather than analytically.
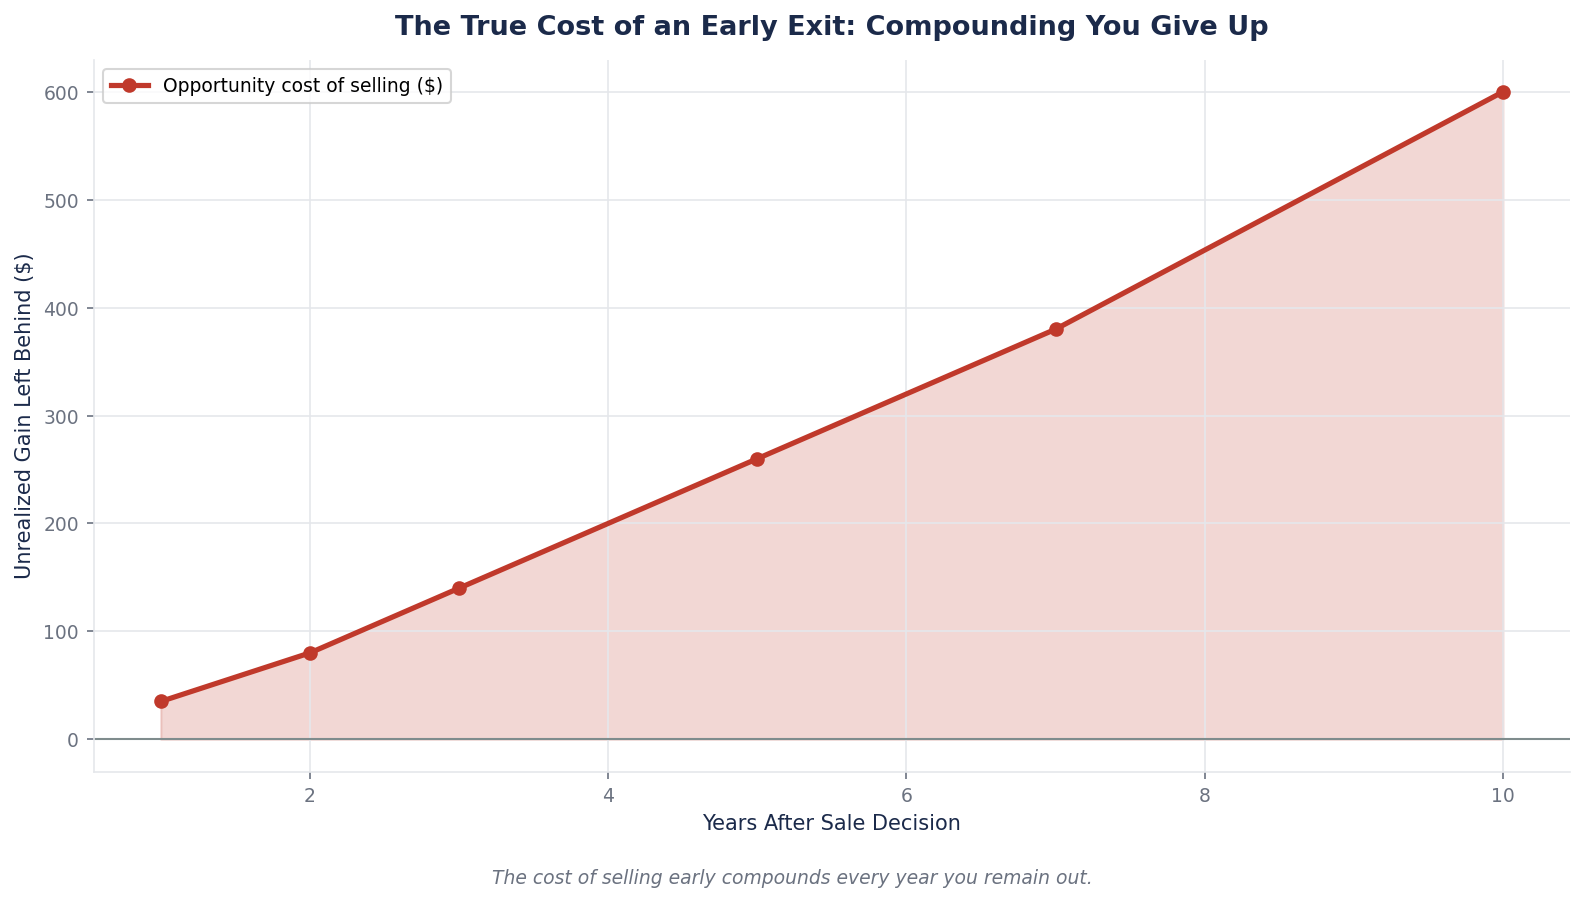
The math of compounding is unforgiving on this point. A single 10-bagger held for a decade often contributes more to lifetime portfolio returns than dozens of 50-percent gains taken early. Selling winners is, more often than not, the single most expensive mistake an investor makes. But holding losers is also expensive, and in a different way — the opportunity cost of capital tied up in a broken thesis compounds negatively against you.
This week we build a framework for the only three reasons that legitimately justify selling a long-term position, and we examine a real case that illustrates the cost of getting the sell decision wrong: Apple, over the ten years from 2014 to 2024.
Core Framework: The Three Legitimate Reasons to Sell
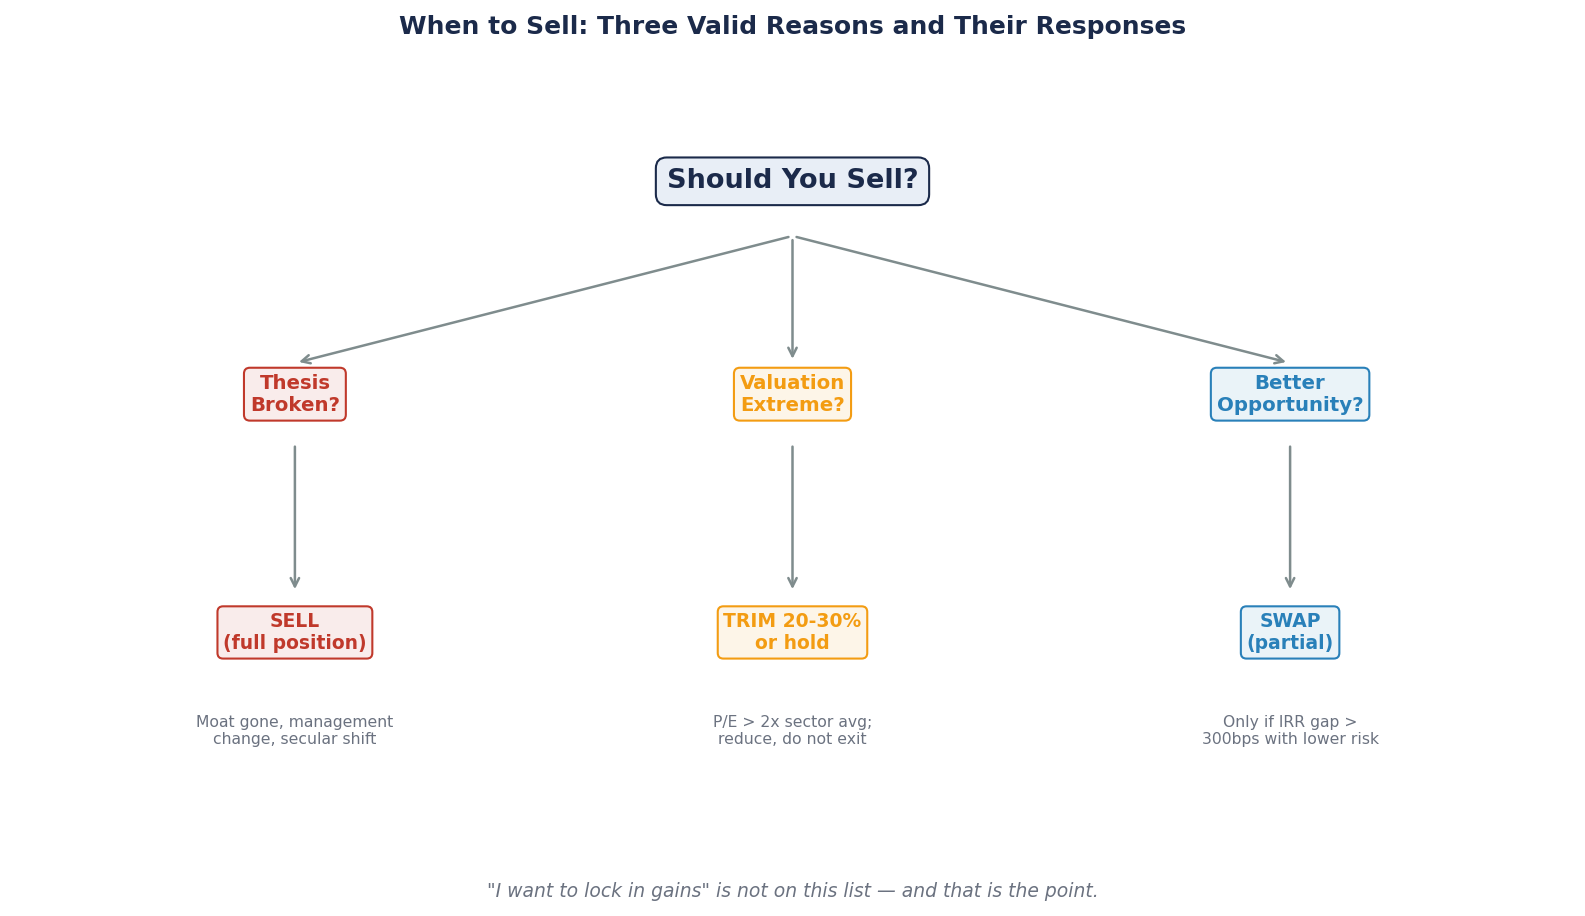
Across decades of professional investing literature, only three reasons actually qualify as legitimate justifications for selling a position you purchased on a long-term thesis.
| Reason | What It Means |
|---|---|
| 1. The thesis is broken | The specific investment case that justified buying no longer holds |
| 2. Valuation has become extreme | Current price fully discounts even the most optimistic scenario |
| 3. Better opportunity with higher expected return | Capital can earn substantially more elsewhere, after costs |
Notice what is NOT on this list. "The stock has gone up a lot" is not a reason. "The stock has gone down a lot" is not a reason. "I want to lock in gains" is not a reason. "I need the money for something else" is a legitimate financial-planning reason but not an investment reason. "I'm nervous about the market" is not a reason. "A friend told me to sell" is definitely not a reason.
Each of the three legitimate reasons demands specific analytical work. Most reasons retail investors give themselves for selling do not.
The Case: Apple, 2014 to 2024
In September 2014, Apple split its stock 7-for-1. The split-adjusted price was approximately $25 per share. The company had spent the prior 18 months in a sharp run-up — the stock had roughly doubled from its 2013 lows as the iPhone 5s and 6 drove renewed growth.
At that moment, two investors held identical 100-share positions purchased at $15 in 2013. Both had nearly 70 percent paper gains. Both faced the "should I sell?" question at the same time.
Investor A sells in September 2014. "Apple had a great run, I'm locking in gains." Proceeds: approximately $2,500. Reinvested in an S&P 500 index fund and held for 10 years.
Investor B holds. Continues to hold through the 2014–2024 decade.
Fast-forward to April 2026.
AAPL total return over the ten years from 2016 to 2026: approximately 955 to 1,070 percent, with dividends reinvested. The annualized return is approximately 27 percent per year for a decade.
S&P 500 total return over the same decade: approximately +240 percent.
Investor A's outcome: Starting with $2,500 in 2014, invested at S&P 500 ~14 percent CAGR over 10 years. Ending value approximately $9,000. A good absolute result — but disappointing relative to what could have been.
Investor B's outcome: Held the original 100 shares. At $273 per share in April 2026, the position is worth approximately $27,300. Plus dividends accumulated, reinvested, and compounded over the decade.
The ratio of outcomes: roughly 3x. The same two investors, same initial position, same ten years. The only difference was the decision in September 2014.
And this scenario was in many ways benign for Investor A. AAPL also had multiple 20–30 percent drawdown periods during the holding window (notably 2015, 2018, 2022). Investor B had to hold through all of them without selling. The pattern of emotional selling at each drawdown would have produced outcomes even further behind Investor B.
The Asymmetry of Compounding
Here is the mathematical reason selling winners is so expensive. Compounding is exponential, not linear. The difference between 10 percent annualized and 27 percent annualized over 10 years is not 17 percentage points. It is the difference between a 2.6x money multiple and a 10.9x money multiple.
Compounded returns over 10 years:
| Annualized Return | 10-Year Multiple |
|---|---|
| 5% | 1.63x |
| 10% | 2.59x |
| 15% | 4.05x |
| 20% | 6.19x |
| 25% | 9.31x |
| 30% | 13.79x |
An investor who sells a position compounding at 27 percent and redeploys to something compounding at 12 percent loses most of the eventual wealth, not a fraction of it. The higher the compounding rate, the more expensive early sale becomes.
This is why selling winners is almost always a mistake. You are trading an exponential for a linear alternative. The trade can look reasonable in the first year or two (the redeployed capital also grows). By year ten, the gap is irrecoverable.
The Corollary: Why Holding Is Hard
Most retail investors intellectually understand this math. The reason they still sell early is behavioral, not analytical. Three specific biases drive the pattern.
1. Loss aversion. Humans feel the pain of losing $1,000 roughly twice as sharply as the pleasure of gaining $1,000. Holding a stock that has doubled feels risky because any retracement feels like "losing" gains, even though those gains were never promised. The pull to "protect" the paper profit is powerful even when the underlying thesis has strengthened, not weakened.
2. Anchoring to purchase price. Once a stock has doubled, the purchase price becomes a psychological reference point. "It's already 100 percent above where I bought it" triggers a sense that the stock must be closer to its high than its low. This feeling has no analytical basis — the current price is anchored to current business value, not to historical purchase price — but it drives behavior regardless.
3. Overconfidence in predicting tops. After a run, many investors convince themselves they can time the top. "I'll sell here and buy back lower." Empirical studies consistently show this approach underperforms simply holding. The reason is simple: you have to be right twice (sell high and buy back lower) instead of once. Missing either side compounds against you.
Reason 1 to Sell: The Thesis Is Broken
Of the three legitimate reasons, thesis-break is the most important and the hardest to execute.
A thesis-break sell is not "the stock went down." It is: the specific investment case that justified buying no longer holds. Your reasons for owning the company have been invalidated by subsequent information.
What a thesis break actually looks like:
- You bought for the moat. Competitive entry has neutralized the moat.
- You bought for the growth rate. Growth has structurally decelerated.
- You bought for management quality. Management has left or changed direction.
- You bought for the product platform. The platform has been disrupted.
- You bought for the capital structure. Balance sheet risk has emerged.
In each case, the justification is not the price action. It is a specific, observable change in the business that invalidates the original analysis.
The Intel Case Revisited
Last week we walked through Intel's 2005–2024 moat erosion year by year (W17). For an investor who had bought Intel in 2005 based on "manufacturing leadership + x86 network effects + high ROIC durability," the thesis break happened somewhere between 2019 and 2022 when AMD's server share gains compounded to roughly 18 percent, Apple Silicon transitioned the Mac business off Intel, and Intel's own 10nm and 7nm process transitions slipped multiple years.
A disciplined thesis-based investor would have sold Intel somewhere in 2019–2022, accepting a gain smaller than the 2021 peak but avoiding the 60–70 percent drawdown through 2024. A price-based investor waiting for "confirmation" in the financial statements would have ridden the full decline.
The lesson: watch the thesis, not the price. Price-based selling is reactive and late. Thesis-based selling is proactive and can be early, but it is mathematically superior when the thesis has genuinely broken.
Writing Down Exit Triggers in Advance
The hardest part of thesis-based selling is admitting the thesis is wrong. Human beings rationalize. The fix is to write down exit triggers in advance, before you have any emotional attachment to the position.
For each holding, write three specific observations that would make you exit. Examples:
- "If revenue growth falls below 15% for two consecutive quarters"
- "If operating margin compresses below 25% and does not recover within three quarters"
- "If the CEO or two of the top three executives depart"
- "If a competitor's comparable product achieves 20% market share"
When any of these triggers fires, sell. Do not rationalize why this specific situation is different. The whole point of pre-committed triggers is to force discipline at the moment when emotion wants to override analysis.
Reason 2 to Sell: Extreme Valuation
The second legitimate sell reason is valuation extremity — when the current price fully discounts even the most optimistic scenario.
This is a different reason from "the stock has gone up." A stock can go up 100 percent and still be reasonably valued if the underlying business has also grown 100 percent. A stock can go up 50 percent while the business stagnated, producing valuation extremity without proportional earnings growth.
The test: using the three-method valuation framework from W13 — DCF, comparables, precedent transactions — what do the three methods say about current price?
Case 1: All three methods suggest the stock is 50–200 percent above fair value. You are in valuation-extreme territory. Even if the thesis is intact, the price has discounted the thesis and more. This is a legitimate sell reason.
Case 2: All three methods suggest the stock is 20 percent above fair value. You are in "above fair value" territory but not "extreme." Holding is usually appropriate because the range of outcomes is not skewed to downside.
Case 3: Methods disagree, some suggest extreme overvaluation, others suggest reasonable value. Investigate the disagreement. Often the resolution will clarify whether the thesis has shifted, in which case the sell is thesis-based, not valuation-based.
The Tesla Example
At various points in 2021–2022, Tesla's P/E exceeded 800x. DCF-implied fair value was a fraction of the trading price. Comparable auto companies traded at 10–20x. The disagreement between Tesla's multiple and any standard comparable was so extreme that a pure valuation-extremity sell was defensible.
An investor holding Tesla at the $400 peak in late 2021, applying the W13 framework, would have concluded that the stock's implied valuation required specific, extreme assumptions about autonomy, robotics, and AI outcomes that had not yet been validated. Selling on valuation extremity at that price, even with a strong long-term thesis, was a defensible analytical choice.
Current Tesla trading (~$373 in April 2026) is still at extreme multiples (P/E ~200x+) relative to auto comps, but the Physical AI thesis has matured (Robotaxi in limited deployment, Terafab announced, FSD 456K subscribers) — the valuation extremity conversation is more nuanced now than in the 2021 peak. An investor's choice between "hold for thesis" and "sell for extreme valuation" is genuinely debatable at current prices, which is exactly what the 58/C+ BEAF score reflects.
Reason 3 to Sell: Better Opportunity
The third legitimate sell reason is capital reallocation — moving money from a lower-expected-return position to a higher-expected-return position, after accounting for transaction costs and taxes.
This is the hardest of the three to execute well, because "better opportunity" is often a rationalization for simply wanting to trade. The discipline is to compare expected returns explicitly and honestly.
The analysis framework:
1. Calculate your current position's expected return over the next 3–5 years
2. Calculate your alternative position's expected return over the same horizon
3. Apply tax-adjustment to the current position (if selling triggers taxable gain, your real proceeds are reduced)
4. Apply transaction costs (bid-ask spread, commission if any)
5. Compare the tax-adjusted, cost-adjusted expected returns
Example:
- Current position: MSFT at current price, expected return over 3 years of +14% annualized = 48% total
- Alternative: newly-researched company, expected return over 3 years of +22% annualized = 82% total
- Tax on MSFT sale (assume 15% long-term capital gains): reduces proceeds by ~8% of position value
- Net comparison: 48% held vs (82% × 0.92 = 75% reinvested)
After adjusting, the alternative's expected return premium is 27 percentage points over 3 years — large enough to justify the swap. Without the adjustment, an investor might have concluded the difference was 34 percentage points and overreached.
The Capital Allocation Discipline
This kind of swap should happen rarely — perhaps once or twice a year in a well-constructed portfolio. The reason is that when you have done thorough thesis work on your existing holdings, the "better opportunity" threshold is high. Most new ideas, on closer inspection, are not actually better than your existing highest-conviction positions. They are just newer.
The test for whether this is a real capital allocation improvement: would you buy the alternative at the current price if you had cash? If yes, and if the alternative is clearly superior to your lowest-conviction current holding, the swap is justified. If the alternative is slightly better than your average holding, the swap usually is not worth the tax cost.
The Common Mistake: Selling When Everything Is Fine
The single most destructive pattern in retail investing is selling a position that is performing exactly as the thesis predicted.
The stock is up 40 percent. Revenue is accelerating. Margins are expanding. New customers are signing multi-year contracts. The moat is deepening. By every observable metric, the thesis is working. And the investor sells because "it's had a great run and I want to lock in gains."
This pattern — selling functioning compounders — is the inverse of what disciplined investors do. Warren Buffett's observation that his "favorite holding period is forever" does not mean no stock should ever be sold. It means that when a compounder is compounding, the default action is to hold. Only the three reasons above justify overriding that default.
The AAPL Investor A / Investor B contrast above is not a special case. It is typical. The investors who built the largest fortunes over the last several decades of US equity investing did so largely by holding — or even adding to — winning positions for many years after "a lot of the upside was already priced in." The investors who "took profits" along the way systematically underperformed.
The Common Mistake: Holding Losers Too Long
The complementary error is holding positions where the thesis has genuinely broken, but selling would force acknowledging a mistake.
"I bought at $100, it's at $60, I'll wait for it to come back." This is emotional, not analytical. The decision to own the stock at $60 is mathematically identical to the decision to buy the stock at $60. If you would not buy it at $60 today with cash, you should not hold it at $60 today. The purchase price is a historical accident, not a decision-relevant data point.
The discipline is to run the thesis analysis every year as if you were buying from scratch. Does the current investment case support holding from today's price? If yes, hold. If no, sell — regardless of what you paid for the position originally.
For positions with broken theses, selling at a loss is psychologically painful but mathematically correct. The opportunity cost of capital tied up in a broken story is often larger than the remaining downside risk from continuing to hold. Cutting the loss and redeploying is almost always the better choice.
A Checklist for Running the Annual Thesis Review
For each holding, answer the following once per year:
1. Why did I originally buy this? Write down the thesis in 2–3 sentences.
2. Is that thesis still intact? Yes / Partial / No, with evidence.
3. If I had cash today, would I buy at current price? Yes / No, with reasoning.
4. Did any pre-committed exit triggers fire this year? If so, why didn't I sell?
5. What would need to change for me to double the position? To exit entirely? Write the conditions.
Most of your positions will pass this review easily. A few will reveal thesis drift. Those are the positions to examine carefully — often they are either sell candidates (broken thesis) or add candidates (thesis stronger than before).
What to Watch
Three habits separate investors who sell well from investors who sell badly.
Track thesis status, not price. Your portfolio reporting should include, for each position, a note on whether the underlying thesis is on-track, ahead, or behind expectations. Price tells you what the market thinks. Thesis tells you what you think. The gap between the two is where trading opportunities live — and where trading mistakes live.
Write exit triggers in advance and review quarterly. The single most effective discipline is pre-committing to specific observable events that would change your decision. Vague triggers ("if things get bad") do not work. Specific triggers ("if operating margin is below 25% for 3 quarters") force disciplined action when emotion wants to override.
Distinguish portfolio trimming from thesis-based selling. If a single position has grown to 15 percent of your portfolio, selling some to bring it back to 8–10 percent is a risk management action, not a thesis-based decision. Trimming to target weight is fine. Selling "because it had a run" is the mistake. Keep the two decisions analytically separate.
Brutal Edge Coverage Integration
This week's framework maps directly onto our coverage:
- NVDA Deep Dive (BEAF 83/B+) — the specific thesis triggers that would justify selling NVDA are documented in the Deep Dive, including hyperscaler custom-silicon share thresholds, AI capex cycle signals, and the specific competitive developments that would invalidate the current thesis. Owners of NVDA should reread these triggers quarterly.
- TSLA Deep Dive Rev.2 (BEAF 58/C+) — the 58/C+ score reflects genuine uncertainty about when and how the thesis resolves. For TSLA specifically, the exit-trigger discussion is central to position management. The Rev.2 documents both the bullish resolution (Robotaxi scales, Physical AI thesis validates) and the bearish resolution (regulatory setbacks, narrative breaks) in equivalent detail.
- Microsoft Deep Dive (BEAF 81/B+) — the cleanest "hold forever" candidate in current coverage. Exit triggers require significant Azure deceleration, regulatory action on AI, or a specific shift in enterprise cloud adoption. None of these appears imminent, which is why MSFT is the archetype of the compounder that rewards long holding.
- Physical AI Sector Report — documents the sector-level signals that would affect multiple holdings simultaneously. If the entire Physical AI thesis deteriorates, correlations will tighten (per W23) and rebalancing across multiple positions may be warranted.
For additional frameworks, see our Deep Dive archive.
Curriculum Closing
You have reached the end of Investing 101 Intermediate. Over 24 weeks we have covered:
Module 1 — Valuation (W13–W15): The three methods of valuation, the hidden sensitivities in DCF, and how to read multiples across peers.
Module 2 — Moats (W16–W18): The five structural competitive advantages, the four paths of moat erosion, and how to read new-technology moats from behavioral signals before the financial evidence matures.
Module 3 — Disclosure Reading (W19–W21): The 10-K sections that reveal what companies prefer to hide, the earnings call signals that move markets, and the proxy statements where governance structure becomes visible.
Module 4 — Portfolio Construction (W22–W24): The Kelly Criterion for position sizing, the correlation analysis that reveals hidden concentration, and the three legitimate reasons to sell.
Together, these modules build the intermediate toolkit: understanding what businesses are worth, what makes them durable, what disclosures reveal, and how to construct a portfolio that reflects conviction without taking unintended concentration risk.
Most retail investors never get past the beginner-level skill set. The intermediate skills — the ones we have covered in this series — compound meaningfully over decades of investing. An investor who rigorously applies these frameworks will not guarantee outperformance, because no framework guarantees outperformance. But they will be making decisions from a different analytical basis than most market participants, which is exactly where long-term edge actually comes from.
Beyond this series, the Brutal Edge Deep Dive archive is where these frameworks are applied to specific companies, with BEAF scores, scenario analysis, and specific exit triggers. Reading the series alongside the archive is the most complete way to see each framework in practice across multiple real businesses.
For now, sit with the full 24-week journey. The frameworks are useful individually. They compound when held together.
Brutal Edge. Frameworks over forecasts. Signal over noise.
Disclaimer. Brutal Edge is an independent investment research platform. This report is published for educational and informational purposes only and does not constitute investment advice, a recommendation to buy or sell any security, or an offer to transact in any financial instrument. All valuations, forecasts, and opinions are the analyst's own and are subject to change without notice. Past performance does not guarantee future results. Readers should conduct their own due diligence and consult a qualified financial professional before making investment decisions.
Educational content only. Not investment advice. Always do your own research.