16 Positions. 1 Bet. The Diversification Illusion.
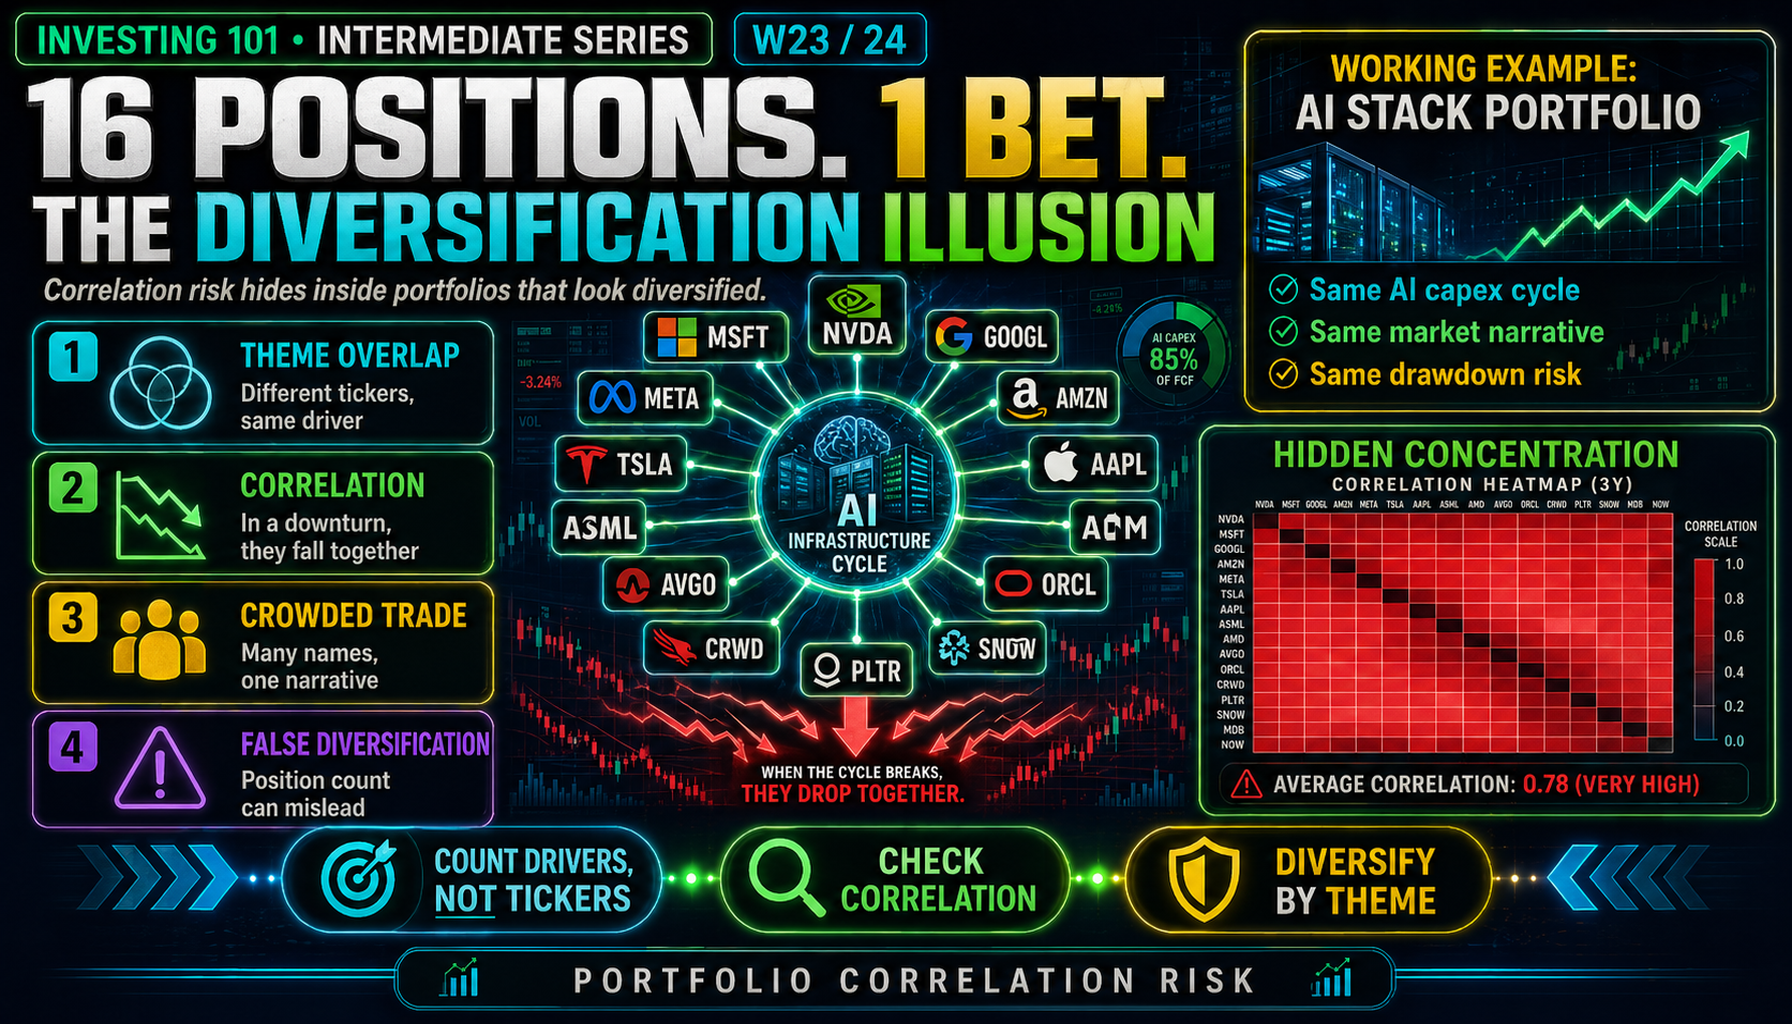
An investor holding NVDA, MSFT, GOOGL, META, AMZN, TSLA, AAPL, plus ASML, AMD, AVGO, ORCL, CRWD, PLTR, and SNOW believes they own 14 positions. They own one position: the AI trade. This week we show why the diversification investors think they have is not the diversification they actually have.
Diversification Illusion
Ask ten retail investors what diversification means, and nine will say "don't put all your eggs in one basket." They are correct in principle and catastrophically wrong in practice. The mistake is not in the principle. The mistake is in the definition of "basket."
Consider an investor with 16 positions, distributed equally. Intuitively, the portfolio is well-diversified — 16 different companies, 16 different tickers, 16 different CEOs, 16 different business models. But if the 16 positions are NVIDIA, Microsoft, Alphabet, Meta, Amazon, Tesla, Apple, ASML, AMD, Broadcom, Oracle, CrowdStrike, Palantir, Snowflake, MongoDB, and ServiceNow, the portfolio is not actually diversified at 16 positions. It is one concentrated bet on the AI infrastructure cycle — one theme, with 16 different proxies.
When the AI capex cycle peaks and rolls over, all 16 names will decline together. Their operating results will diverge in the medium term, but over a 6-to-18-month window, the correlation in their price action will approach 1. The portfolio will experience a drawdown closer to a single-name loss than to a 16-position average. Position count alone cannot protect you from this pattern. Only thematic diversification — or cross-asset-class allocation — can.
This is correlation risk, and it is the most common way retail portfolios fail at diversification despite appearing to follow the textbook rules. This week we examine it concretely, using actual Magnificent 7 performance data and a realistic 16-position portfolio example, and build a framework for detecting and correcting the hidden concentration that position count alone hides.
Core Framework: The Three Layers of Diversification
True diversification happens at three different layers, and only when all three are addressed can a portfolio be said to be genuinely diversified.
| Layer | What It Addresses | Measure |
|---|---|---|
| Position count | Idiosyncratic risk (one company blowing up) | Number of holdings |
| Sector / theme | Factor risk (one industry or trend reversing) | % weight in largest sector or theme |
| Correlation structure | Systemic co-movement (hidden beta to a single driver) | Cross-holding correlation matrix |
Position count addresses the easiest kind of risk and is the one retail investors focus on most. Sector concentration is the second layer, partially addressed by people who explicitly track "sector weights." Correlation structure is the deepest and most often ignored — it requires looking at how the positions actually move together, which can reveal concentrations that sector classification does not expose.
The Magnificent 7 provide the textbook example of how correlation structure hides behind apparent diversification.
The Magnificent 7: Diversification on Paper, Correlation in Practice
Seven stocks. Seven different business models. Seven different industries by traditional classification.
Different industries, right?
| Stock | Primary Industry Classification |
|---|---|
| Apple (AAPL) | Consumer Electronics |
| Microsoft (MSFT) | Software |
| Alphabet (GOOGL) | Communication Services / Advertising |
| Amazon (AMZN) | Consumer Discretionary / E-commerce |
| Nvidia (NVDA) | Semiconductors |
| Tesla (TSLA) | Automotive |
| Meta (META) | Communication Services / Advertising |
At a glance, a portfolio holding all seven looks diversified across multiple industries. But watch what happens in market stress.
2022 bear market performance:
| Index / Group | 2022 Return |
|---|---|
| S&P 500 | -19.4% |
| Magnificent 7 | -41.3% |
The Mag 7 declined more than 2x the broad index in 2022. This was not random. All seven had material exposure to the same underlying drivers — global monetary policy, technology capital expenditure cycles, consumer digital-ad spending, valuation multiples — and when those drivers reversed, the correlations that had looked modest in the prior bull market revealed themselves to be extreme.
2020 bull market performance (inverse of the same pattern):
| Index / Group | 2020 Return |
|---|---|
| S&P 500 | +16.3% |
| Magnificent 7 | +65.8% |
Over 4x the broad index. Same companies, same correlation structure, different direction. A portfolio concentrated in the Mag 7 had beta of roughly 2x during the up cycle and 2x+ during the down cycle. That is not diversification — that is a leveraged bet on one factor.
The Structural Drivers Behind Mag 7 Correlation
Why do ostensibly different businesses move together? Because they share structural exposures that override industry classification.
1. AI capex cycle. NVIDIA supplies the chips. MSFT, GOOGL, META, and AMZN are the largest buyers. TSLA is a major incremental spender through its Physical AI and chip infrastructure buildout. AAPL is the outlier (historically lower direct AI capex), which is precisely why its 2025 return (~+9%) underperformed the rest of the group.
2. Global advertising cycle. GOOGL and META derive the majority of revenue from digital advertising. AMZN has a rapidly growing ad business. MSFT has LinkedIn and search-ad exposure. AAPL has app-store-driven advertising downstream. When global ad spending slows, 5 of the 7 have correlated exposure.
3. Consumer discretionary spend. AMZN, AAPL, TSLA, and META (through reality-labs and consumer device ambitions) all have material exposure to consumer spending health. A consumer slowdown hits multiple Mag 7 names directly.
4. Interest-rate sensitivity. All seven are long-duration growth assets whose DCF valuation is highly sensitive to discount-rate changes. When 10-year yields rise materially, all seven reprice in the same direction. This is the pure valuation-multiple driver that affects every long-duration equity, and the Mag 7 are maximally long-duration.
5. US tech regulatory exposure. Antitrust risk on AAPL, GOOGL, META, and AMZN is overlapping. China-related supply chain risk affects AAPL, TSLA, NVDA, and to a lesser extent the others. Tariff policy changes reprice the group together.
Each of these drivers produces correlated movement across names that "industry classification" would call distinct. The classification is misleading. The drivers are what matter.
The Approximate Correlation Matrix
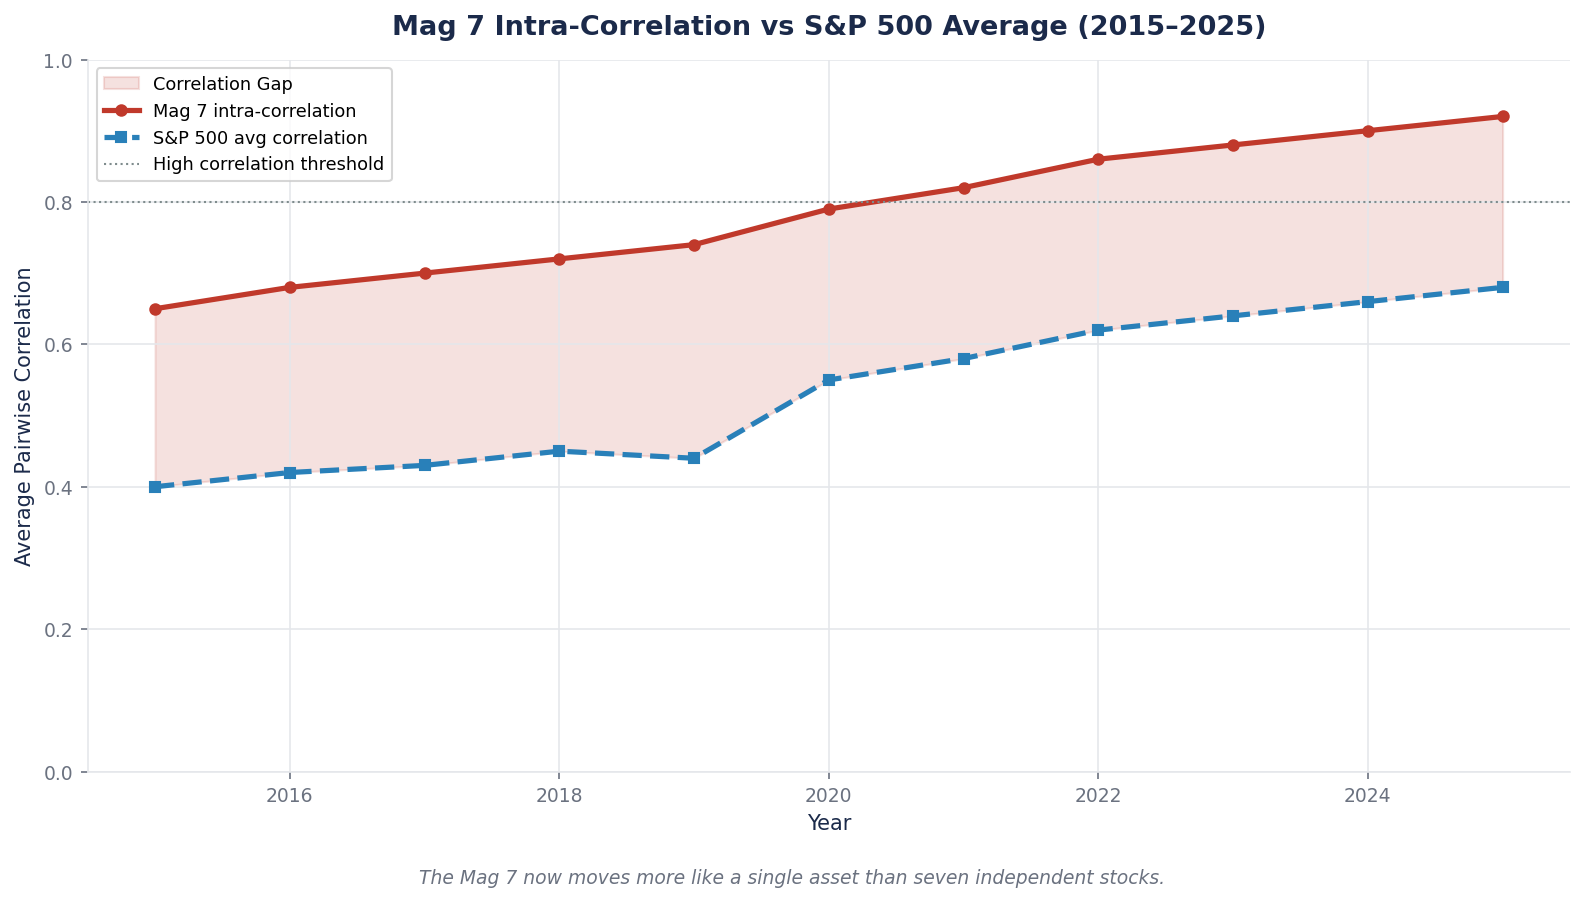
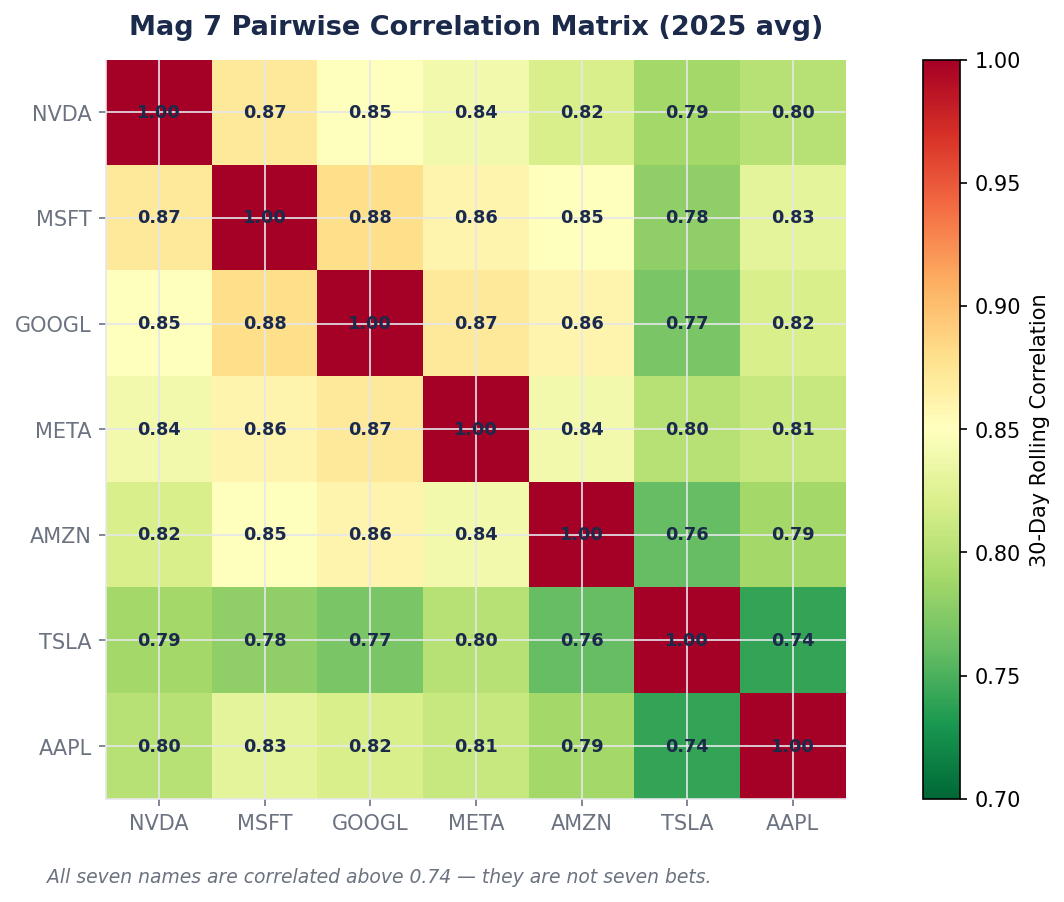
Historical monthly return correlations among the Mag 7, over rolling 3-year windows, typically show:
| Pair | Typical Correlation |
|---|---|
| AAPL — MSFT | 0.80 – 0.85 |
| NVDA — AMD (for broader context) | 0.75 – 0.85 |
| MSFT — GOOGL | 0.75 – 0.80 |
| GOOGL — META | 0.70 – 0.80 |
| AMZN — MSFT | 0.70 – 0.80 |
| NVDA — MSFT | 0.65 – 0.75 |
| TSLA — group (average) | 0.40 – 0.55 (lower, Musk-specific factors) |
| AAPL — NVDA | 0.55 – 0.70 |
A correlation of 0.75 between two positions means that approximately 75 percent of their shared variance is explained by common factors. In portfolio math, this means holding both is only modestly better than holding one at 2x the weight — the volatility reduction from adding the second position is small.
Tesla is the partial exception. Because Musk-specific factors (political activity, SpaceX and xAI interactions, personal compensation disputes) introduce idiosyncratic variance not present in other Mag 7 names, Tesla's correlation with the group is meaningfully lower. This is not a defense of Tesla as a holding — it is a specific observation that Tesla's idiosyncratic risk is larger than a "Big Tech" holding's idiosyncratic risk.
The 16-Position Portfolio Case
Extend this analysis to a realistic "growth tech" portfolio that a retail investor building on popular names might actually construct:
The portfolio:
| Category | Holdings |
|---|---|
| Mag 7 | AAPL, MSFT, GOOGL, AMZN, META, NVDA, TSLA |
| AI infrastructure adjacents | ASML, AMD, AVGO, ORCL |
| Software AI exposure | CRWD, PLTR, SNOW, MDB, NOW |
16 positions, equal-weighted at ~6.25% each.
Apparent diversification: Yes. 16 names, 6 different sub-industries.
Actual diversification: No. Nearly every holding has material exposure to the AI infrastructure capex cycle. ASML sells lithography equipment to chipmakers building for AI. AMD and AVGO are direct participants. ORCL is pivoting to AI-workload cloud. CRWD and PLTR are AI-software-adjacent. SNOW, MDB, and NOW are data-infrastructure plays with AI demand exposure. The only arguable diversifier is TSLA, and we just saw that TSLA's correlation with the group is partial not absent.
Weighted by correlation to the AI capex theme, this portfolio's effective thematic concentration is approximately 80 percent in AI-cycle exposure. On paper it looks like 16 positions. In correlation reality, it is one 80 percent bet.
What Happens When the Cycle Turns
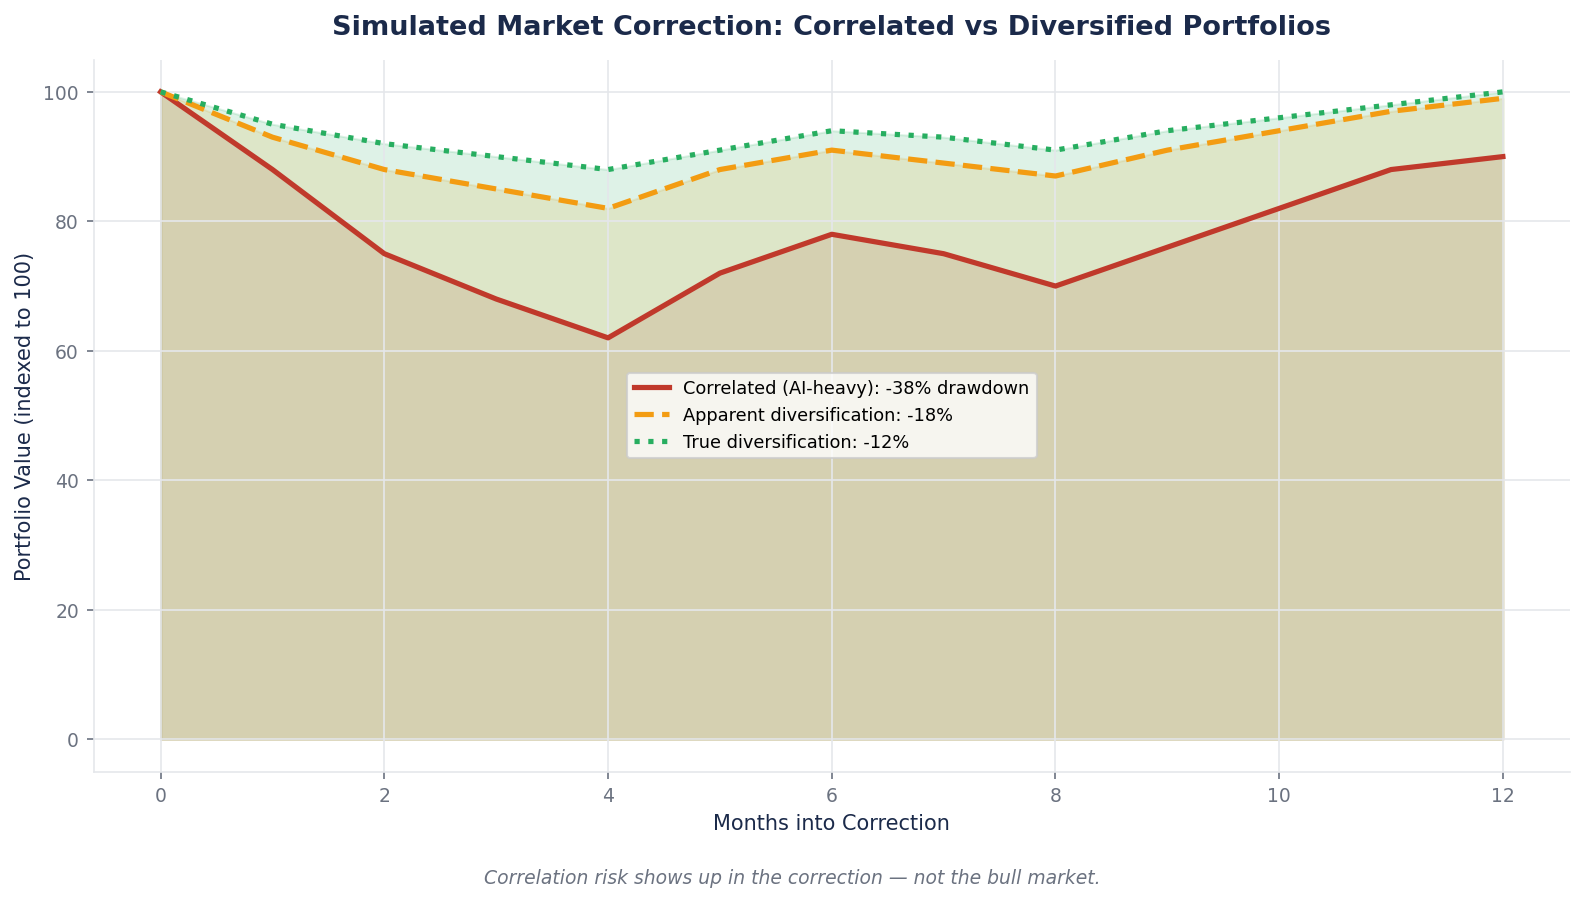
Past AI-related corrections (like the 2022 reset, the brief May 2025 drawdown, and periodic capex-concern-driven pullbacks) have shown correlation compression — positions that moved independently during normal markets move together during stress. A 15 percent AI-cycle correction in such an environment would typically produce:
- Mag 7 names down 15–25% on average
- AI-adjacent names down 20–35%
- The "16-position growth tech" portfolio down approximately 18–28% despite appearing diversified
Compare this to a portfolio with actual thematic diversification:
- Mag 7 (8%) + Healthcare (8%) + Industrials (8%) + Financials (8%) + Consumer staples (8%) + Energy (8%) + International equity (16%) + Fixed income (20%) + Real estate (8%) + Commodities/gold (8%)
A portfolio structured this way would experience materially less drawdown during an AI capex reversal, because most of its weight is exposed to drivers that do not correlate with AI sentiment. The positions in the first portfolio may outperform in a bull continuation. The positions in the second portfolio will reduce drawdown when the cycle turns. These are fundamentally different risk profiles that position count alone cannot distinguish.
The Three Types of Portfolio Concentration
To operationalize correlation analysis, think about concentration in three distinct ways.
Type 1: Single-Name Concentration
Any single position above 10–15 percent of portfolio value is a single-name concentration. This is the easiest risk to detect — it is a number in your portfolio summary. It is addressed by position caps (discussed last week in the Kelly framework).
Type 2: Theme Concentration
The sum of positions exposed to the same underlying theme. For our 16-position example above, "AI capex cycle" theme concentration is approximately 80 percent. Theme concentration is harder to detect because it requires categorizing holdings by exposure rather than by industry classification.
Common theme concentrations that retail portfolios hide:
- AI / cloud capex cycle (Mag 7, semis, software, data infrastructure)
- Rate-sensitive growth (all long-duration equity, including most tech names)
- Consumer discretionary (across retail, auto, consumer services, and major e-commerce)
- Commodity cycle (energy, materials, emerging markets, and some industrials)
- US dollar strength / weakness (international equity, commodities, EM debt)
A portfolio with high concentration in any of these themes is vulnerable to the theme's reversal — regardless of how many positions it contains.
Type 3: Factor Concentration
The deeper layer. Factor concentration refers to exposure to academic-factor-model dimensions: value vs growth, large-cap vs small-cap, quality vs low-quality, momentum vs reversal, US vs international. A 16-position portfolio might be entirely large-cap growth-momentum-quality, which means it is effectively one factor bet despite position count.
Factor concentration is measured using factor regressions (beyond the scope of this week's framework) but has a simple retail-accessible proxy: check whether your portfolio positions mostly came from similar idea sources. If every position is from "things I read about in tech podcasts and AI newsletters," your factor concentration is high. If positions were sourced from actively different analytical domains (valuation screens, dividend-yield screens, international small-cap, private real estate), factor diversity is higher by default.
Case Study: Measuring Correlation in a Real Portfolio
Consider two investors with 20-stock portfolios, both US large-cap.
Investor A's portfolio includes:
- 7 Mag 7 names
- 4 semiconductor names (NVDA, AVGO, AMD, ASML)
- 3 hyperscaler-adjacent cloud names (ORCL, CRWD, PLTR)
- 3 AI-software names (SNOW, MDB, NOW)
- 3 consumer names (DIS, NKE, SBUX)
Investor B's portfolio includes:
- 2 Mag 7 names (MSFT, GOOGL)
- 2 financials (JPM, BRK.B)
- 2 healthcare (UNH, JNJ)
- 2 industrials (HON, UNP)
- 2 consumer staples (PG, COST)
- 2 energy (XOM, COP)
- 2 international (TSM, NESN)
- 2 real estate (EQR, PLD)
- 2 defensive (TMO, MCD)
- 2 diversifiers (gold ETF, treasury ETF)
Investor A has more positions in "hot" names and will likely outperform in an AI-continuation bull market. Investor B has fewer exciting names and will likely underperform in that environment.
But look at what happens in a 20-percent AI-cycle drawdown scenario:
| Scenario | Investor A drawdown | Investor B drawdown |
|---|---|---|
| AI capex hard reset | -22% | -8% |
| Energy spike / inflation return | -12% | -5% |
| Broad market recession | -28% | -14% |
| Prolonged sideways (flat for 24 months) | -5% | -2% |
Investor B's portfolio gives up some upside in the best years. It gives up much less downside in the worst years. Over a full cycle, the drawdown-adjusted returns typically favor Investor B even if the peak nominal return is lower. This is the structural benefit of correlation-aware diversification, and it is what position count alone cannot capture.
Rebuilding Diversification Without Sacrificing Conviction
The hardest objection to correlation-aware diversification is that it forces you to hold positions you have less conviction in. "Why would I own utilities when I have high conviction in AI?"
This is a real tension, and there is no perfect answer. But there are three practical approaches that balance conviction with correlation discipline.
1. Cap thematic exposure explicitly. Decide in advance that no theme will exceed 30–40 percent of portfolio weight. Within that cap, concentrate in your highest-conviction names. If AI is your top conviction theme, hold 35 percent across your best 5 AI names rather than 80 percent across 16 mediocre AI names. The conviction is preserved. The correlation exposure is controlled.
2. Use uncorrelated asset classes. Cash, short-duration fixed income, and physical gold historically have low correlation to equity themes. Holding 10–20 percent of a portfolio in these instruments materially reduces overall correlation exposure without requiring you to own equities you do not want.
3. Seek out structural diversifiers within equity. Emerging-market equity, international small cap, real assets (REITs, infrastructure), and certain defensive sectors (consumer staples, utilities) have lower correlation to US large-cap growth than most retail investors assume. Adding these does not mean abandoning conviction — it means building conviction in a broader opportunity set.
The goal is not to eliminate concentration. It is to make concentration a deliberate choice with quantifiable risk rather than an accidental byproduct of idea sourcing.
The Common Mistake: "I Own the Best Companies, So I'm Safe"
The most destructive thinking pattern in correlation analysis is the belief that owning the "best" companies protects against correlation risk.
It does not. Great companies in a single theme still move together when the theme reverses. NVIDIA is one of the highest-quality businesses in the S&P 500. It was down approximately 50 percent peak-to-trough in 2022, despite the business fundamentals remaining intact. Microsoft and Apple are arguably the two most resilient mega-cap businesses of the last decade. Both were down 25–30 percent in the 2022 drawdown.
Quality does not insulate against correlation. Quality determines which positions recover faster after a drawdown. The drawdown itself is a function of theme exposure, and even the highest-quality names in a theme experience the full theme drawdown.
The implication: even if your analytical process identifies only high-quality companies, you still need correlation-aware diversification. Quality is a stock-picking discipline. Diversification is a portfolio-construction discipline. They are orthogonal skills and both are required.
What to Watch
Three habits will turn correlation awareness from an abstract concept into a portfolio discipline.
Build a theme-weight spreadsheet, not just a position-weight spreadsheet. For each holding, classify it by primary theme exposure (AI capex, advertising cycle, consumer discretionary, rate-sensitive growth, etc.). Sum weights by theme. If any theme exceeds 30–40 percent, you are concentrated in that theme regardless of how many positions you hold. Review this quarterly.
Actively diversify idea sources. Positions sourced from similar information channels will have similar factor exposure. Deliberately seek investment ideas from domains you do not naturally read about — emerging markets, fixed income, real estate, international value. You do not have to invest in every domain. But the exposure to ideas should be diversified so that portfolio construction has genuine choices rather than reflexive concentration.
Run periodic stress tests. Pick specific historical analogies (2022 AI reset, 2008 financial crisis, 2000 dot-com, 1973–1974 stagflation) and ask: what would my current portfolio have done in that environment? The answer is rarely precise, but the exercise reveals which parts of the portfolio would protect and which would compound losses. If the answer is "everything goes down together," the portfolio is under-diversified by the correlation test regardless of the position count.
Brutal Edge Coverage Integration
This week's framework maps directly onto our coverage:
- Physical AI Sector Report — the sector concentration problem is central to our coverage. A portfolio of Tesla plus hyperscalers plus chip suppliers looks like three bets and is one thematic bet. The report quantifies the overlap and suggests specific ways to maintain thematic conviction while reducing correlation exposure.
- NVDA Deep Dive (BEAF 83/B+) — the 83 score reflects the business, not the portfolio context. An NVDA position in a portfolio that already has 50 percent Mag 7 weight is a very different investment decision than NVDA as the primary AI exposure in an otherwise diversified portfolio. Position context matters for sizing.
- TSLA Deep Dive Rev.2 (BEAF 58/C+) — Tesla's lower correlation to the Mag 7 group makes it a partial diversifier within growth tech holdings, which is a separate consideration from its standalone investment merits. A small Tesla position in a Mag 7 concentrated portfolio provides more diversification per dollar than a sixth hyperscaler.
- Microsoft Deep Dive (BEAF 81/B+) — MSFT's correlation to other Mag 7 names is high (0.75–0.85), meaning it does not diversify a portfolio that already holds AAPL, GOOGL, or AMZN. Portfolios can be over-concentrated in quality just as easily as in speculation.
For additional frameworks, see our Deep Dive archive.
Looking Ahead
We have covered how to size positions (W22) and how to recognize hidden correlation (W23). Next week we close the curriculum with the hardest decision in investing: when to sell. For most retail investors, selling is either too fast (panic on drawdowns) or too slow (holding losers too long). We build a framework for the three legitimate reasons to sell a position and contrast two real investors — one who sold Apple in 2014 after a 100% run, one who held through 2024 — to show why holding is usually the harder and more valuable skill.
For now, sit with this week's lesson. A portfolio of 16 positions is not diversified unless the 16 positions have genuine correlation diversity. Position count is the easy layer of diversification. Theme and factor are the deeper layers, and they require looking past industry classification to the actual drivers of movement. Investors who master this layer have an edge over those who do not — because most of them do not.
Brutal Edge. Frameworks over forecasts. Signal over noise.
Disclaimer. Brutal Edge is an independent investment research platform. This report is published for educational and informational purposes only and does not constitute investment advice, a recommendation to buy or sell any security, or an offer to transact in any financial instrument. All valuations, forecasts, and opinions are the analyst's own and are subject to change without notice. Past performance does not guarantee future results. Readers should conduct their own due diligence and consult a qualified financial professional before making investment decisions.
Educational content only. Not investment advice. Always do your own research.