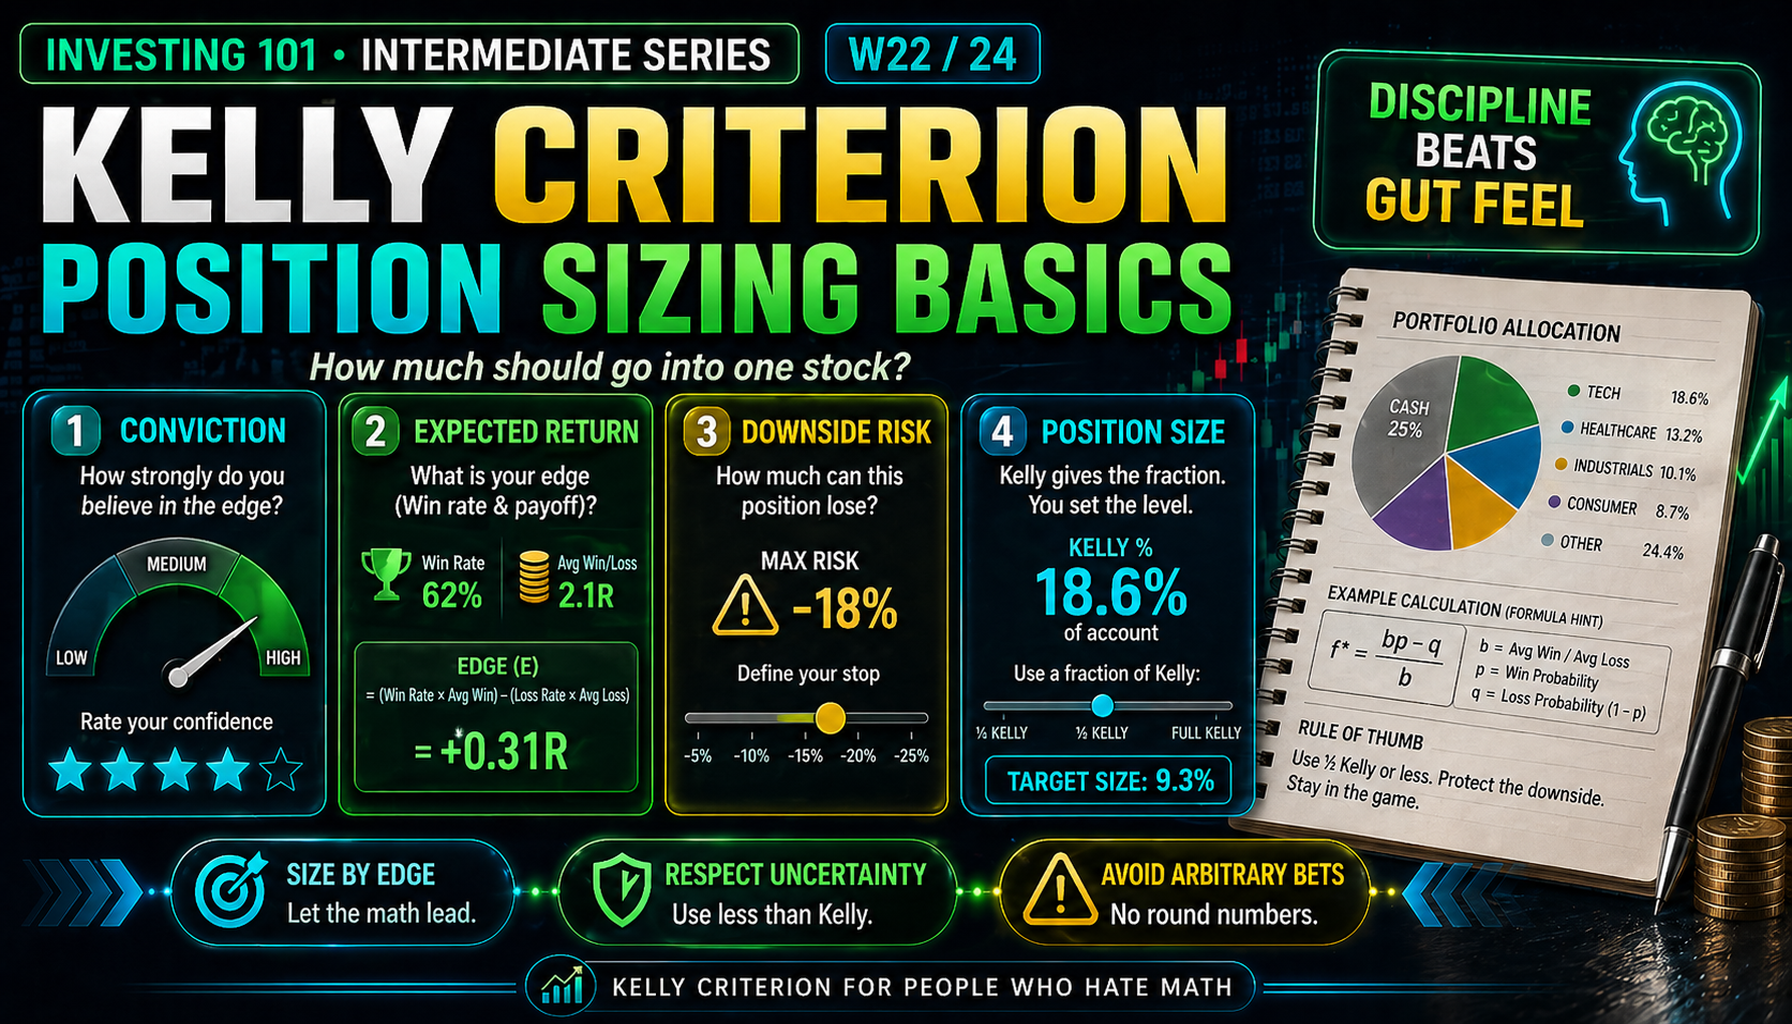
Kelly Criterion for People Who Hate Math
You have done the valuation work. You have identified the moat. Now you have to decide how much of the portfolio goes into this one name. Most retail investors answer by feel. This week we apply the Kelly Criterion to three real holdings.
Position Sizing
Here is a common scene. An investor spends three weeks researching a company. They read the 10-K. They listen to earnings calls. They run a DCF. They evaluate the moat. They conclude the stock is an attractive buy. Then they open their brokerage account and type in the order.
At that moment, they make a decision that matters at least as much as any analytical work they have done: they decide how much to buy. And for almost all retail investors, this decision is made by feel. "I'll put $10,000 in it." "I'll buy 100 shares." "I'll make it 5 percent of the portfolio." The number is pulled from the air. The analysis that produced it was extensive. The sizing that applied it was arbitrary.
This is the position-sizing problem, and it is one of the most consistently neglected areas of intermediate investing. Position sizing is not a footnote to stock selection. It is arguably more than half of what determines portfolio outcomes. An excellent stock at 1 percent position size contributes almost nothing to returns. A mediocre stock at 15 percent position size can dominate the portfolio for years. Getting sizing right matters. Getting it wrong systematically — which most retail investors do — explains a significant portion of why portfolio returns tend to lag the indices they track.
This week we apply a specific framework — the Kelly Criterion, adapted for real-world equity investing — to three names from the Brutal Edge coverage universe: NVIDIA, Tesla, and Microsoft. By the end you will have a concrete method for sizing any position based on your conviction, your expected return, and your downside exposure — and a clear sense of why equal-weight or gut-feel sizing systematically underperforms.
Core Framework: The Kelly Criterion, Simplified
The Kelly Criterion is a mathematical formula for optimal bet sizing when both the probability of winning and the payoff are known. It was developed by John Kelly at Bell Labs in 1956 and has been applied to professional gambling, sports betting, and investment portfolios for decades. Full-strength Kelly is aggressive — it maximizes the geometric growth rate of wealth under idealized conditions. Practically applied, most professional investors use "fractional Kelly" (typically 0.25x to 0.5x full Kelly) to account for the uncertainty in the inputs themselves.
The simplified formula for equity investing:
Optimal Position % = Edge ÷ Uncertainty
More precisely: Kelly % = (W × A − L × B) / (A × B)
| Variable | Meaning |
|---|---|
| W | Probability of winning (your expected win rate) |
| L | Probability of losing = 1 − W |
| A | Expected loss if wrong (in %) |
| B | Expected gain if right (in %) |
The formula is not the important part. The discipline of filling in the inputs is.
The Five-Point Conviction Scale
For retail investors working without professional risk models, a practical simplification that captures the essence of Kelly is a five-point conviction scale combined with expected-return and downside estimates.
| Conviction Level | What It Means | Kelly Multiplier |
|---|---|---|
| 5 — Very high | Thesis is well-understood, multiple confirming signals, strong moat | Up to 10% position |
| 4 — High | Thesis is clear, good signal-to-noise, identifiable moat | Up to 7% position |
| 3 — Moderate | Thesis is plausible, some uncertainty on key inputs | Up to 5% position |
| 2 — Exploratory | Early-stage research, thesis not yet proven | Up to 2% position |
| 1 — Speculative | Opportunistic, high uncertainty, asymmetric upside only | Up to 1% position |
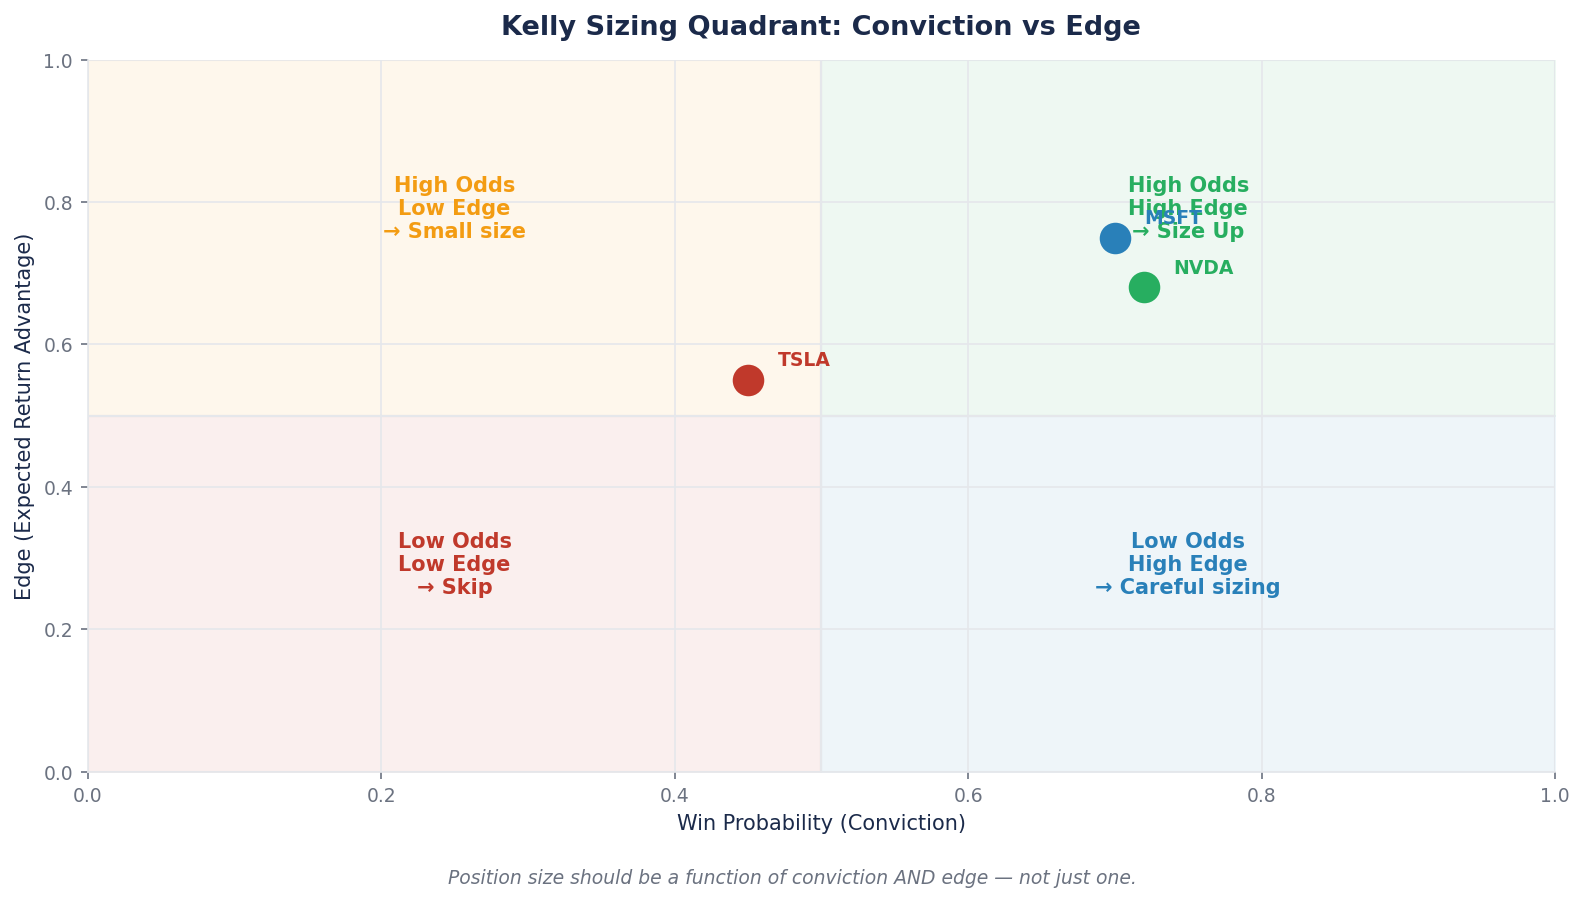
The Kelly Criterion enforces a specific discipline: your position size should reflect both your conviction and the asymmetry between upside and downside. A high-conviction holding with a moderate expected return and a large potential drawdown should NOT be sized as large as a high-conviction holding with the same expected return and a smaller drawdown. Equal-weight portfolios violate this principle by definition.
Applying Kelly to Three Real Names
Let us apply this framework to three names from Brutal Edge coverage. We will use approximate current prices (mid-April 2026) and realistic scenario analysis rather than wishcast numbers.
NVIDIA (NVDA) — BEAF Score 83/B+
Current state (April 2026):
- Price: ~$200
- Forward P/E: ~24x
- Revenue growth (FY26): +65%
- FY27 Q1 revenue guidance: $78B (55% YoY)
- ROIC: 126%
- Forward PEG: 0.63
Scenario analysis (3-year horizon):
| Scenario | Probability | Price Outcome | Return |
|---|---|---|---|
| Bull — Rubin ramp + AI capex sustains | 30% | $350 | +75% |
| Base — Deceleration but still growing | 45% | $260 | +30% |
| Bear — Hyperscaler custom silicon erodes share | 20% | $150 | -25% |
| Severe bear — AI capex cuts abruptly | 5% | $90 | -55% |
Expected return: (0.30 × 75%) + (0.45 × 30%) + (0.20 × -25%) + (0.05 × -55%) = +28%
Downside exposure (weighted): (0.25 × average loss) × average magnitude = effective downside of approximately 10–15%
Conviction level: 5 (Very high) — strong financial signature, clear moat, measurable operational progress, matches all three moat tests from W16.
Kelly-suggested position: 8–10% of portfolio. The combination of strong upside (+28% expected), manageable downside (severe-bear scenario is only 5% probability), and high conviction supports a meaningful position.
Tesla (TSLA) — BEAF Score 58/C+
Current state (April 2026):
- Price: ~$373
- Forward P/E: ~202x
- Revenue growth (FY25): -3%, FY26 accelerating to ~+11%
- FCF (Q1 2026): $1.4B, guided negative for rest of year
- ROIC (TTM): ~3% (compressed)
Scenario analysis (3-year horizon):
| Scenario | Probability | Price Outcome | Return |
|---|---|---|---|
| Bull — Robotaxi scales + Optimus in production | 25% | $600 | +60% |
| Base — Slow progress, mixed results, trading sideways | 35% | $400 | +7% |
| Bear — Autonomy regulatory setbacks, margin compression persists | 30% | $250 | -33% |
| Severe bear — Narrative breaks, multi-year repricing | 10% | $150 | -60% |
Expected return: (0.25 × 60%) + (0.35 × 7%) + (0.30 × -33%) + (0.10 × -60%) = -1%
Downside exposure: (0.40 × average loss magnitude) = effective downside of approximately 20–25%
Conviction level: 3 (Moderate) — narrative bet with measurable milestones, but valuation requires specific assumptions to hold that cannot yet be independently verified (per W13 framework).
Kelly-suggested position: 3–5% of portfolio. The near-zero expected return combined with significant downside exposure dictates a small position even for an investor who believes the Physical AI thesis. Pure Kelly math on these inputs would produce an even smaller or zero position — but the framework allows room for thesis-driven exposure when the narrative components justify participation.
Microsoft (MSFT) — BEAF Score 81/B+
Current state (April 2026):
- Price: ~$416
- Forward P/E: ~29x
- Revenue growth (Q2 FY26): +17%
- Azure growth: 39% YoY
- Commercial RPO: $625B (+110% YoY)
- Operating margin: ~44%
- YTD 2026: -14%
Scenario analysis (3-year horizon):
| Scenario | Probability | Price Outcome | Return |
|---|---|---|---|
| Bull — Copilot monetization + Azure capex pays off | 30% | $570 | +37% |
| Base — Steady compounding, margin pressure from capex | 45% | $480 | +15% |
| Bear — Azure decelerates faster than expected, capex concerns | 20% | $370 | -11% |
| Severe bear — Cloud saturation + regulatory pressure | 5% | $280 | -33% |
Expected return: (0.30 × 37%) + (0.45 × 15%) + (0.20 × -11%) + (0.05 × -33%) = +14%
Downside exposure: (0.25 × average loss) = effective downside of approximately 8–10%
Conviction level: 5 (Very high) — durable switching-cost moat, measurable business metrics, strong free cash flow, cleanest large-cap compounder profile.
Kelly-suggested position: 9–10% of portfolio. Highest conviction plus modest-but-durable expected return plus manageable downside produces the largest individual Kelly allocation of the three.
The Three-Stock Portfolio
Apply Kelly sizing to the three positions:
| Position | Conviction | Expected Return | Suggested Kelly Size |
|---|---|---|---|
| NVDA | 5 | +28% | 9% |
| TSLA | 3 | -1% | 4% |
| MSFT | 5 | +14% | 10% |
Total "directional equity" allocation: 23% of portfolio to these three names. The remaining 77% goes to other positions, index exposure, or cash — each sized by the same methodology.
Kelly vs Gut Feel: The Most Common Retail Mistake
Most retail investors size positions using one of three intuition-based shortcuts, and each produces predictable failures.
Mistake 1: Equal weighting. Splitting capital evenly across 10 holdings means a low-conviction position gets the same weight as a high-conviction one. This approach optimizes for diversification at the cost of return capture. Your best ideas are underweighted; your worst ideas are overweighted.
Mistake 2: Conviction-only sizing. "I'm very confident about this stock, so I'll put 25 percent in." This approach ignores downside. A stock you are highly confident in but which has 50 percent drawdown potential under specific scenarios is not a safe 25 percent position — it is a position that could single-handedly take 12 percent off your portfolio in a bad month.
Mistake 3: Emotion-based sizing. "This stock has been going up, so I'll add more." "This stock is down, so I'll cut." Position sizing that moves with recent price action rather than thesis analysis is a documented pattern of retail underperformance. The framework-based approach explicitly decouples sizing from recent price movement.
The Kelly discipline solves all three. It requires you to write down conviction, expected return, and downside exposure separately, and it produces a size that reflects all three. When position size produces an output that feels different from your gut, that divergence is usually the Kelly framework correcting for a specific bias (usually overweighting recent momentum or underweighting downside).
Fractional Kelly: The Professional Adjustment
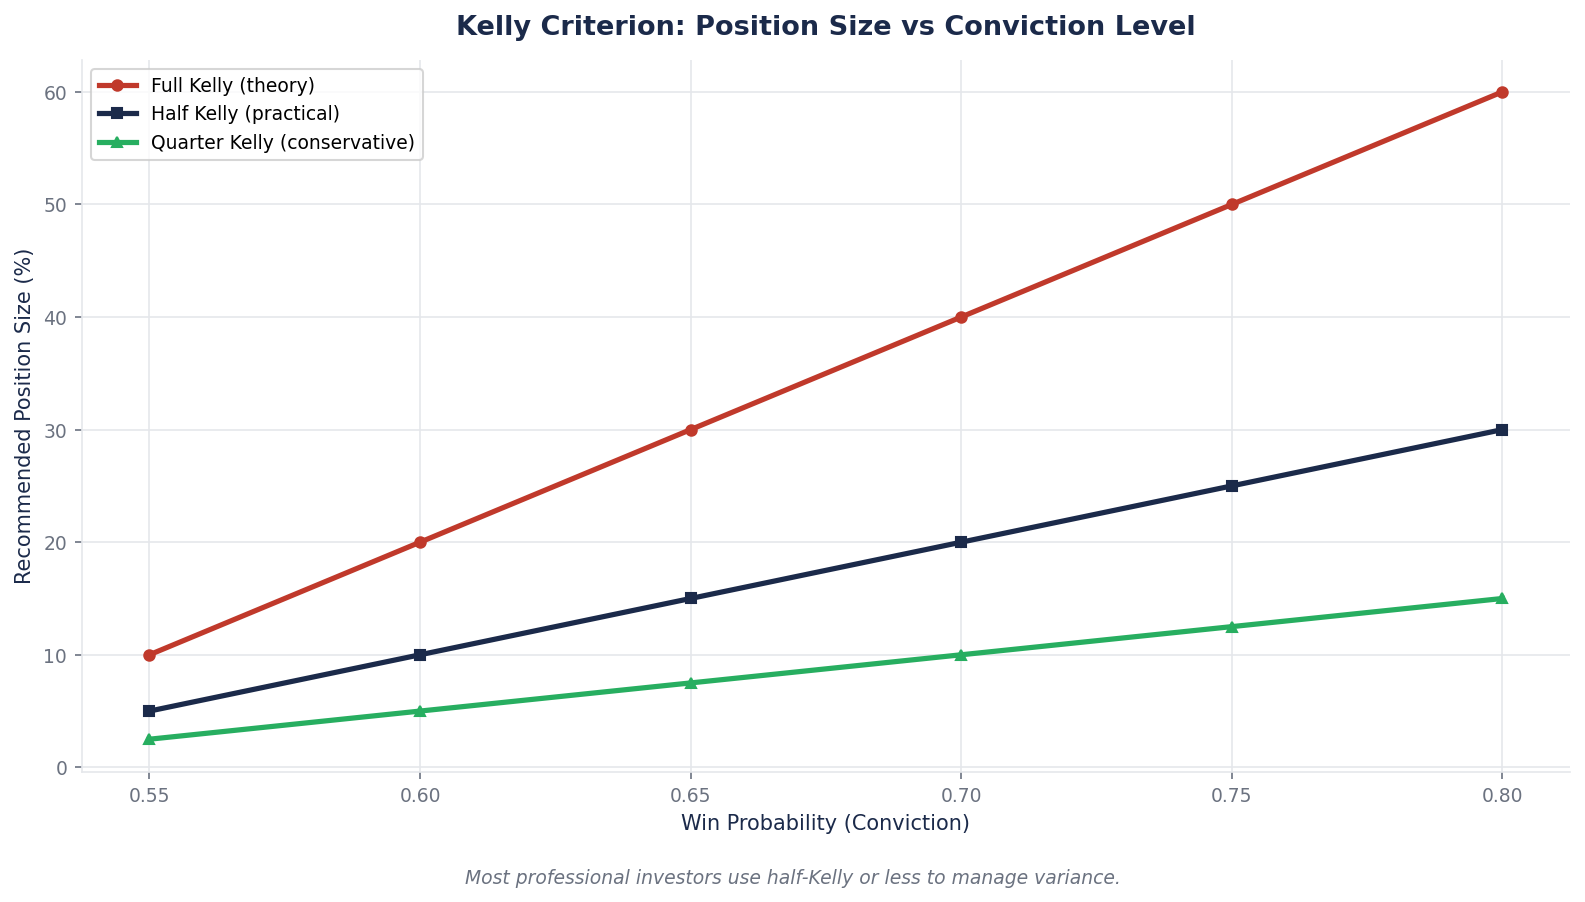
Full Kelly — the formula without adjustment — produces position sizes that are mathematically optimal under idealized assumptions. In practice, most professional investors use 0.25x to 0.5x full Kelly, for two reasons:
1. Input uncertainty. Your estimates of probability and payoff are themselves uncertain. If your scenario analysis has 20 percent error, full Kelly will overbet on positions where your estimates happen to favor large positions. Fractional Kelly dampens the impact of input error.
2. Drawdown tolerance. Full Kelly maximizes the geometric growth rate of wealth but does so with very high drawdown volatility. Most investors have a narrower drawdown tolerance than the math assumes. Fractional Kelly reduces expected return modestly while substantially reducing drawdown risk.
The numbers in the NVDA/TSLA/MSFT analysis above reflect approximately 0.5x Kelly — moderate fractional. An investor with lower drawdown tolerance would use 0.25x, cutting each suggested size in half. An investor willing to accept higher drawdown for higher expected return would use 0.75x or higher.
The key point is that the framework scales cleanly. Once you have done the conviction/return/downside analysis, you can apply whatever Kelly fraction matches your personal drawdown tolerance consistently across all positions. The math does not change; the multiplier does.
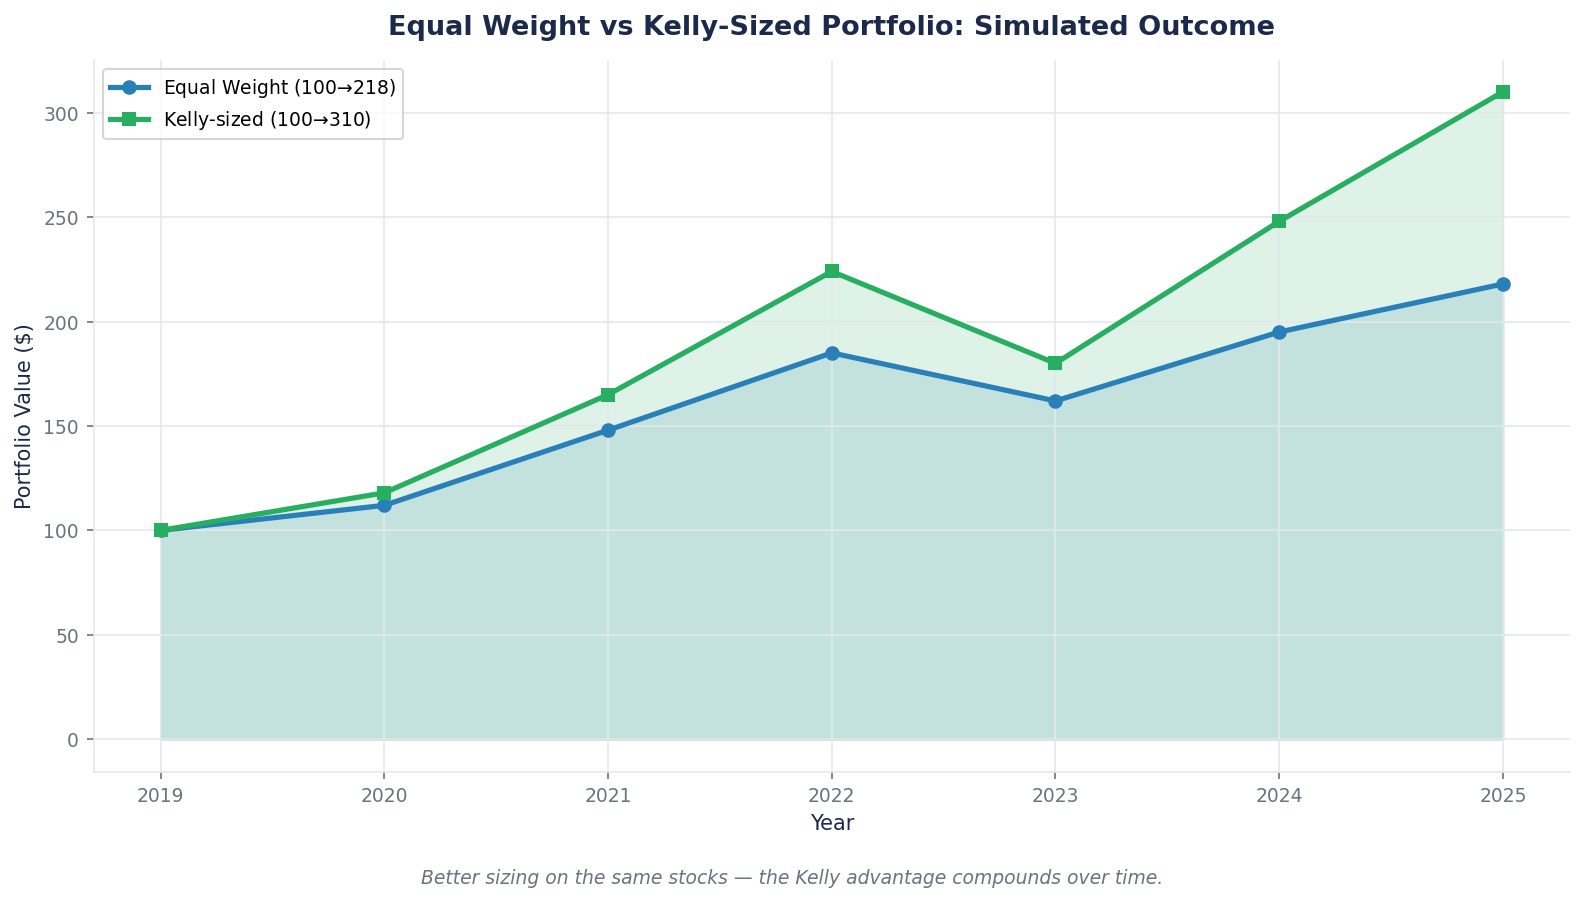
Case Study: Position Sizing Across a Bad Year
Consider two investors who both own the same 10 stocks at the start of a year. Investor A equal-weights at 10 percent each. Investor B applies Kelly sizing based on careful conviction and return/downside analysis.
Over the following year, 6 of the 10 stocks perform in line with base case, 2 outperform the bull case, 2 underperform the bear case.
Investor A (equal weight) experiences full volatility from every position. The 2 underperformers drag ~12 percent off the portfolio. The 2 outperformers contribute ~10 percent. Net portfolio result: mixed, with drawdown exposure from positions Investor A never analyzed for their specific downside.
Investor B (Kelly weight) had smaller positions in the names with asymmetric downside. The same 2 underperformers drag only ~6 percent off the portfolio. The same 2 outperformers contribute ~14 percent because they were sized larger based on high conviction and favorable expected return. Net portfolio result: materially better, with drawdown absorbed through smaller downside exposure on the specific positions that declined.
Over a 10-year horizon, the difference between Investor A and Investor B is typically in the 1.5–3 percent annualized range. Compounded over a decade, that is the difference between doubling and tripling. Position sizing is not a minor detail. It is a meaningful driver of long-term outcomes.
The Common Mistake: Oversizing the Exciting Idea
The single most destructive position-sizing error intermediate investors make is taking their highest-conviction idea to an inappropriate size.
"This is going to be the biggest investment of my career. I'm putting 35 percent in." The thinking sounds disciplined — "I did the work, I know this one best, so I should concentrate." The math is almost always wrong, for two reasons.
First, conviction is never as certain as it feels. You are almost never more than 80 percent confident in any specific thesis, and the 20 percent residual uncertainty combined with the concentration creates drawdown risk that would not be acceptable if written down explicitly. Full Kelly caps aggressive single-name sizing below 20 percent even in cases of very high conviction and very favorable expected return. Above 20 percent you are mathematically exposing the portfolio to single-name failure.
Second, the downside scenarios are often structurally correlated with other holdings. A 35 percent NVDA position is not really 35 percent exposure to NVDA — it is 35 percent exposure to the AI infrastructure thesis, which also overlaps with whatever Mag 7, semiconductor, and hyperscaler exposure the rest of the portfolio has. Oversizing a position is usually oversizing a theme, and the theme's worst-case scenario can take down multiple positions simultaneously. (We will cover this correlation problem specifically in W23.)
The fix is to use the Kelly framework to produce a recommended size and then cap any single name at 10–15 percent even when the framework suggests more. No single position should be able to take the portfolio down more than approximately 5 percent on a 40–50 percent drawdown of that position. This single discipline — a per-position size cap — would prevent most of the catastrophic retail portfolio losses documented in history.
What to Watch
Three habits will turn Kelly-based sizing from a mathematical exercise into an embedded portfolio discipline.
Write down conviction and scenario probabilities before you buy, not after. The most common sizing failure is running Kelly analysis on a position you already own, with numbers that rationalize your current size. The antidote is writing the analysis before opening the position. What is your conviction level? What are the bull/base/bear/severe bear scenarios, with specific price outcomes? What would change your mind? If you cannot write this down crisply, your position should not yet exist.
Revisit the sizing annually, not reactively. Reset positions annually based on updated scenario analysis, not in response to recent price moves. An NVDA position that was sized for a 5 percent allocation two years ago might now be 12 percent of the portfolio after appreciation. The Kelly framework would suggest trimming back toward the target — not because the stock is overvalued, but because the position size now exceeds what the risk/return profile justifies. This is trimming on mechanics, not on thesis, and it is the discipline that professional managers apply as a matter of course.
Apply the cap consistently. Decide your maximum single-position size before you have any specific stock in mind. 10 percent? 15 percent? 20 percent? Write the rule down and follow it. The most common pattern is to pick the rule in the abstract, then break it when "this specific stock is different." Every specific stock feels different when you own it. The rule exists precisely for that moment.
Brutal Edge Coverage Integration
This week's framework maps directly onto our coverage:
- NVDA Deep Dive (BEAF 83/B+) — the scenario analysis used in this week's Kelly application is a simplified version of the full scenario framework in the Deep Dive, which includes specific milestones that would trigger movement between bull and bear cases.
- TSLA Deep Dive Rev.2 (BEAF 58/C+) — the 58/C+ score specifically reflects the risk-adjusted sizing profile we derived here. A moderate-conviction, low-expected-return, high-downside position is not uninvestable — it is investable at a smaller size than gut feeling would suggest.
- Microsoft Deep Dive (BEAF 81/B+) — the cleanest "large position" candidate of the three, with high conviction, durable expected return, and limited downside. The Kelly math makes it explicit: an MSFT-sized position in a portfolio is defensible at 8–10 percent; an equivalent TSLA position is not.
- Physical AI Sector Report — for investors wanting broader exposure to the Physical AI thesis, the sector report covers the specific correlation problem (NVDA, TSLA, and AI infrastructure names all share exposure to hyperscaler capex cycles) which will be the focus of next week's framework.
For additional frameworks, see our Deep Dive archive.
Looking Ahead
The Kelly framework sized three positions in isolation — what each should weigh if you owned it alone. Next week we deal with the harder question: what happens when positions are correlated? If NVDA, TSLA, MSFT, GOOGL, META, and AMZN all move together when AI capex cycles turn, a portfolio of 6 Mag 7 names is not really 6 diversified positions — it is one big AI bet. We take an actual portfolio of 16 large-cap positions and show how correlation analysis reveals hidden concentration that position count alone never captures.
For now, sit with this week's lesson. Position size is not an afterthought to stock selection. It is at least half of the portfolio's outcome over any meaningful period. An investor with average stock picks and rigorous sizing will often outperform an investor with excellent picks and careless sizing. The math does not favor conviction alone. It favors conviction times discipline.
Brutal Edge. Frameworks over forecasts. Signal over noise.
Disclaimer. Brutal Edge is an independent investment research platform. This report is published for educational and informational purposes only and does not constitute investment advice, a recommendation to buy or sell any security, or an offer to transact in any financial instrument. All valuations, forecasts, and opinions are the analyst's own and are subject to change without notice. Past performance does not guarantee future results. Readers should conduct their own due diligence and consult a qualified financial professional before making investment decisions.
Educational content only. Not investment advice. Always do your own research.